Notes:
| GKI Rank | Country | Score | Income Group |
|---|---|---|---|
| 1 | United States | 87.2 | High income |
| 2 | United Kingdom | 73.9 | High income |
| 3 | Germany | 69 | High income |
| 4 | South Korea | 67.9 | High income |
| 5 | Netherlands | 66.5 | High income |
| 6 | Singapore | 65.6 | High income |
| 7 | Sweden | 63.8 | High income |
| 8 | Canada | 63.5 | High income |
| 9 | Saudi Arabia | 63.4 | High income |
| 10 | Japan | 63.1 | High income |
| 11 | Denmark | 62.9 | High income |
| 12 | Norway | 62.8 | High income |
| 13 | Australia | 62.2 | High income |
| 14 | Switzerland | 61.2 | High income |
| 15 | India | 60.2 | Lower middle income |
| 16 | France | 59 | High income |
| 17 | Finland | 58.4 | High income |
| 18 | New Zealand | 57 | High income |
| 19 | Republic of Ireland | 56.4 | High income |
| 20 | United Arab Emirates | 53.7 | High income |
| 21 | Belgium | 53.4 | High income |
| 22 | Austria | 52.9 | High income |
| 23 | Estonia | 50.6 | High income |
| 24 | Spain | 50.5 | High income |
| 25 | Russia | 49.9 | Upper middle income |
| 26 | Italy | 48.9 | High income |
| 27 | Israel | 48.2 | High income |
| 28 | Indonesia | 47.2 | Upper middle income |
| 29 | Malaysia | 46.7 | Upper middle income |
| 30 | Poland | 46.2 | High income |
| 31 | Luxembourg | 46.1 | High income |
| 32 | Portugal | 45.4 | High income |
| 33 | South Africa | 43 | Upper middle income |
| 34 | Cyprus | 42.8 | High income |
| 35 | Czech Republic | 42.7 | High income |
| 36 | Chile | 42.5 | High income |
| 37 | Qatar | 41.9 | High income |
| 38 | Thailand | 41.9 | Upper middle income |
| 39 | Iceland | 41.7 | High income |
| 40 | Hungary | 40.1 | High income |
| 41 | Greece | 39.9 | High income |
| 42 | Romania | 39.8 | High income |
| 43 | Turkey | 39.6 | Upper middle income |
| 44 | Argentina | 38.2 | Upper middle income |
| 45 | Brazil | 38.2 | Upper middle income |
| 46 | Mexico | 37.5 | Upper middle income |
| 47 | Colombia | 37 | Upper middle income |
| 48 | Bulgaria | 36.8 | High income |
| 49 | Philippines | 35.9 | Lower middle income |
| 50 | Bahrain | 34.9 | High income |
| 51 | Ghana | 34.9 | Lower middle income |
| 52 | Mongolia | 34.2 | Lower middle income |
| 53 | Vietnam | 34 | Lower middle income |
| 54 | Kazakhstan | 34 | Lower middle income |
| 55 | Nigeria | 32.3 | Lower middle income |
| 56 | Egypt | 32.3 | Lower middle income |
| 57 | Kenya | 31.8 | Lower middle income |
| 58 | Oman | 31.7 | High income |
| 59 | Malta | 31.2 | High income |
| 60 | Iran | 29.8 | Upper middle income |
| 61 | Rwanda | 29.5 | Low income |
| 62 | Ukraine | 28.2 | Upper middle income |
| 63 | Morocco | 27.6 | Lower middle income |
| 64 | Georgia | 26.8 | Upper middle income |
| 65 | Kuwait | 26.2 | High income |
| 66 | Sri Lanka | 24.3 | Lower middle income |
| 67 | Uzbekistan | 24.2 | Lower middle income |
| 68 | Bangladesh | 23.8 | Lower middle income |
| 69 | Nepal | 20.4 | Lower middle income |
| 70 | Brunei | 20 | High income |
| 71 | Zimbabwe | 17.7 | Lower middle income |
| 72 | Fiji | 17.3 | Upper middle income |
| 73 | Tonga | 15.4 | Upper middle income |
| 74 | Myanmar | 15.2 | Lower middle income |
| 75 | Mozambique | 15 | Low income |
Source for Income Group: World Bank Income Group Classification
Democratic backsliding and polarization are rising in the United States, Israel, France, and India, while Brazil and Hungary face governance challenges. Economic transitions remain uneven—India, Indonesia, and Vietnam show notable progress, while Argentina, Egypt, Ghana, and Pakistan grapple with inflation and instability. United States-China rivalry drives technological decoupling, disrupting semiconductors, AI, 5G, rare earths, and finance. Climate risks accelerate, with extreme events and rising climate-driven migration from Sub-Saharan Africa, the Middle East, and South Asia.
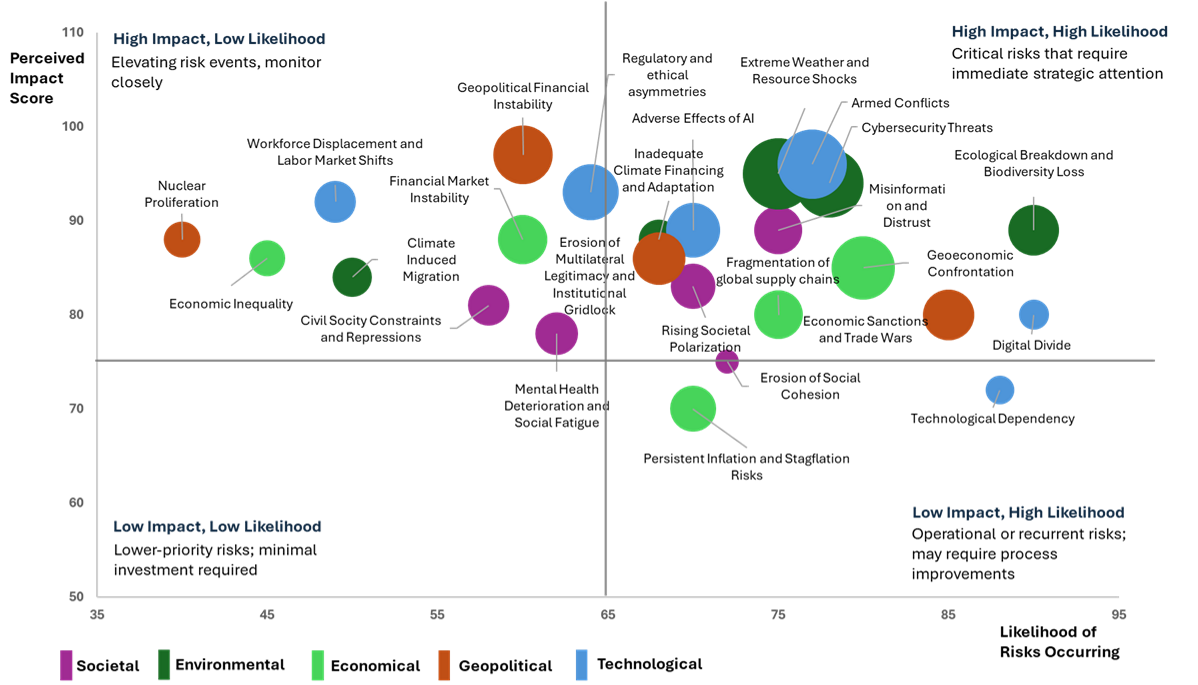
Economic risks, such as inflation and protectionist policies like “Buy European,” hinder funding and scalability, impacting EO start-ups in the United States and EU, and delaying space programs in Southeast Asia and Latin America. Environmental risks, including climate change and orbital congestion, disrupt satellite operations, as seen in California wildfires and South Asian floods. Societal risks, such as strict privacy laws (GDPR, CCPA) and digital inequality, hinder geospatial data adoption, especially in Sub-Saharan Africa. Geopolitical risks are escalating with militarization of space, while technological and financial risks deepen, affecting global geospatial development.
The global geospatial market is projected to grow from USD 454 billion in 2022 to between USD 962 billion and USD 1354 billion by 2030, depending on global risk levels, with a spread of USD 392 billion indicating the sector’s sensitivity to risk and transformative potential. Geopolitical fragmentation, economic slowdown, and cybersecurity threats weaken trust in geospatial systems, risking reduced investment and limited data sharing. Under a High Global Risk Scenario, the market will grow to USD 962 billion by 2030 with a CAGR of 9.3%. Under the Moderate-Risk Scenario, the market will grow to USD 1196 billion, with a CAGR of 12%.

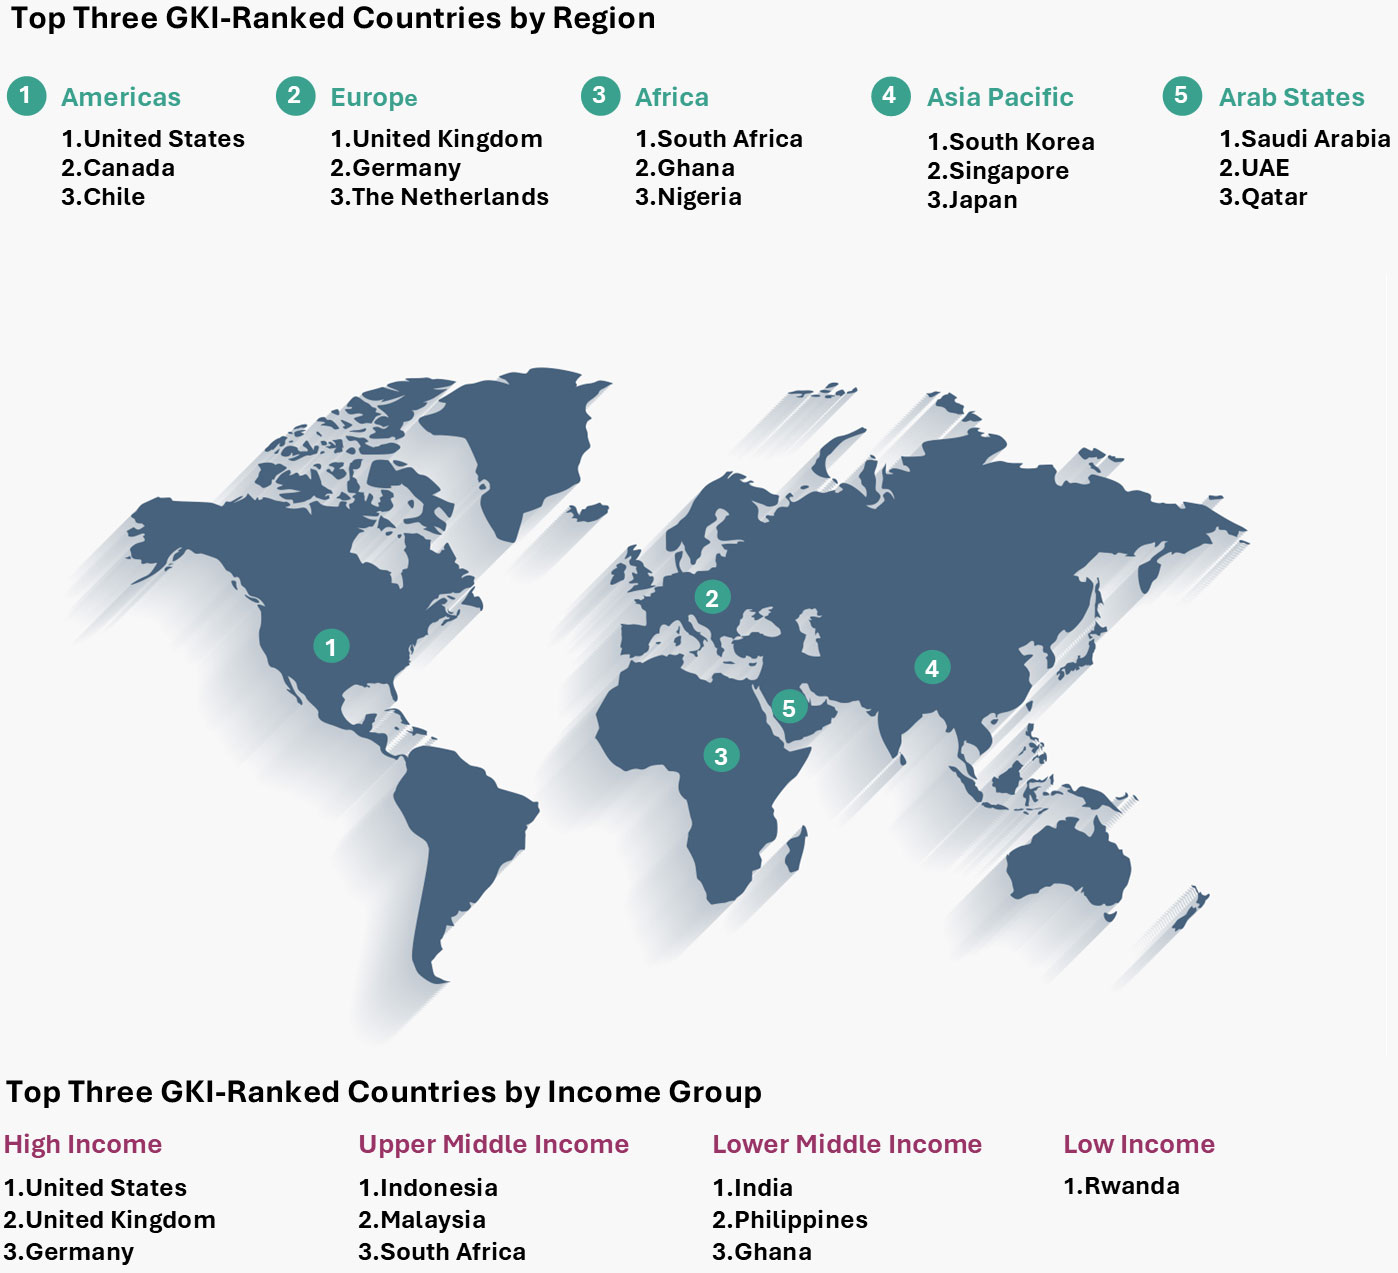
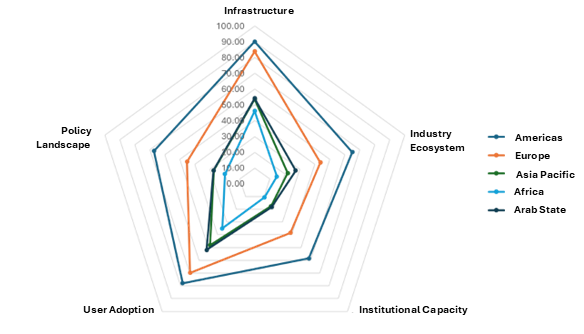
The Americas lead with a coherent ecosystem and policy support, reflected in high-ranking countries like the United States and Canada. Europe follows with strong data infrastructure but coordination gaps, with Germany (3rd), the Netherlands (5th), and Sweden (7th) as top performers. Asia Pacific shows mixed progress—South Korea (4th), Singapore (6th), Japan (10th), Australia (13th), and India (15th) lead, while Sri Lanka (66th), Nepal (69th), and Brunei (70th) lag. Africa and Arab States are in early stages, with Saudi Arabia (9th) and UAE (24th) showing promise amid broader regional challenges in institutional and industry development.
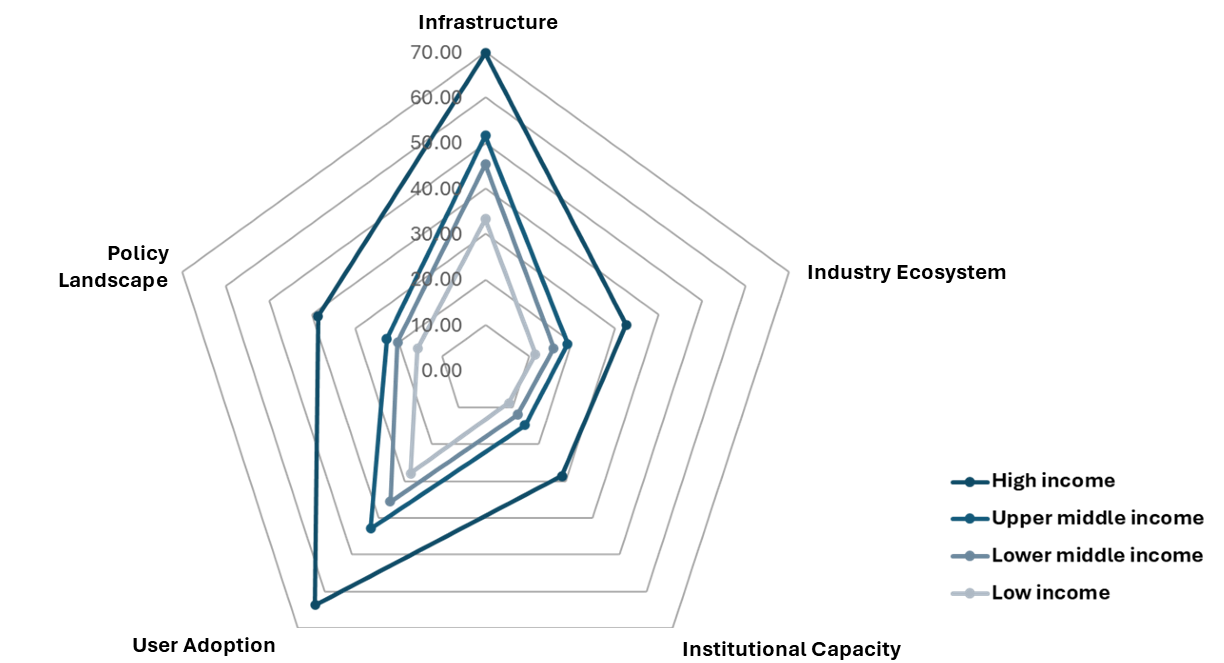
The comparative analysis across income-level economies highlights disparities in digital maturity, investment, institutional capacity, and geospatial integration. Among the 43 high-income countries, most benefit from advanced spatial data infrastructures, strong user adoption, and robust policy frameworks, although over 23 still show moderate readiness. Upper middle-income economies like Indonesia (28th), Malaysia (29th), South Africa (33rd), and Thailand (38th) face institutional fragmentation. Lower middle-income nations such as the Philippines (49th), Vietnam (53rd), Bangladesh (68th), and Nepal (69th) focus on foundational development. Low-income countries like Rwanda (61st) and Mozambique (75th) show potential through pilot initiatives.
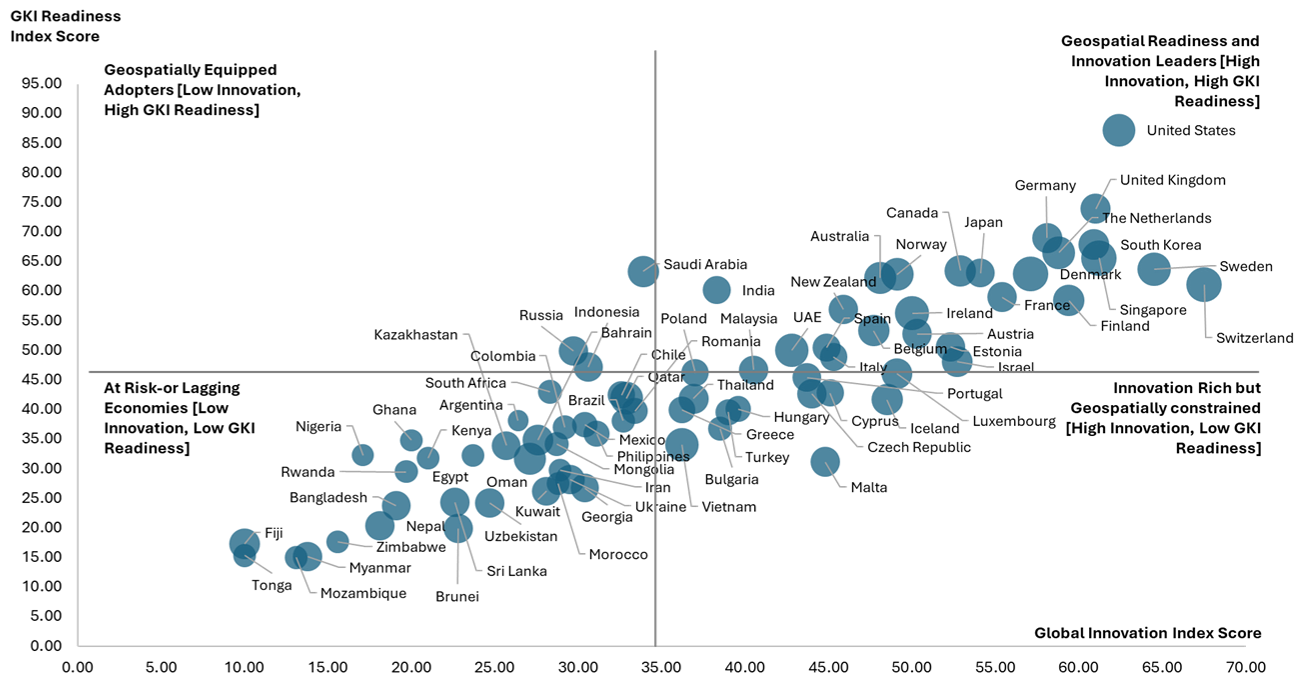
The correlation of Geospatial Knowledge Infrastructure (GKI) maturity with innovation and competitiveness reveals key insights. The United States (1st), United Kingdom (2nd), and Singapore (6th) are leaders, with robust innovation ecosystems and advanced geospatial readiness. Saudi Arabia (9th) is a technology adopter with strong geospatial infrastructure but limited innovation capacity. Countries like Argentina (44th), Ghana (51st), and Zimbabwe (71st) lag in both innovation and geospatial preparedness. The Czech Republic (35th), Greece (41st), and Vietnam (53rd) are innovation-rich but geospatially constrained.