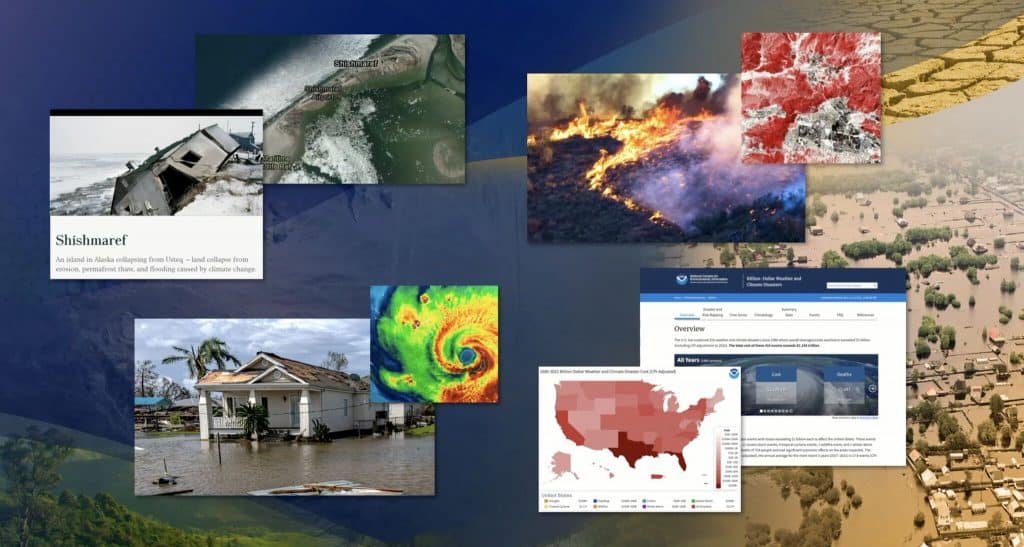
SkyWatch Space Applications Inc., a Kitchener-based space technology company, announces today its Esri Partner Network relationship to deliver satellite imagery for mapping projects and spatial analytics via Esri’s ArcGIS software.
The integration of SkyWatch’s Earth observation (EO) platform,EarthCache, with ArcGIS provides a single aggregate source of EO data from multiple providers. SkyWatch’s transparent pay-as-you-go pricing model provides ArcGIS users with the ability to access high-quality satellite imagery within ArcGIS, without the requirement to maintain commercial relationships with each data provider. Additionally, users are able to discover and acquire data for small areas of interest, which has traditionally been challenging due to minimum area requirements and other limiting factors.
EarthCache is the simplest way to integrate commercial satellite imagery into any application, removing the complexity out of Earth observation data sourcing and processing. EarthCache is a single access point to the best Earth observation data available for application developers and geospatial experts across all industries.
“Esri is the global leader in geographic information systems (GIS) technology and location intelligence and we’re thrilled to partner with Esri to deliver Earth observation data to ArcGIS customers,” says David Proulx, Chief Product Officer at SkyWatch. “We’re looking forward to unlocking simple access to EO data for the geospatial community through the integration of EarthCache and ArcGIS.”
Mercedes F1 Simulator courtesy of Mercedes AMG F1 team
The pinnacle of motor sport is Formula 1, drivers race around tracks in million-pound cars designed to be as efficient as possible at speeds over 200mph. The cars are demonstrations of innovation, with most of the technological breakthroughs filtering down to modern day cars. Without F1, we may never have had antilock brakes (ABS), carbon fibre components, adaptive suspension and even the buttons around the steering wheel.
As the cars have become more refined, mere tenths of a second can mean winning or losing a race, so measuring real time performance and position is vital, and all this technology also gets filtered down for use by business.
They fit each car with over 120 sensors, which generate over 1.1 million telemetry data points per second transmitted from the cars to the pits during a race. These monitor everything from the car’s speed and acceleration to the steering angle to the charge in the energy recovery system to the mass of fuel used to the status of its drag reduction system. This data has to be used in near real-time to solve many of the challenges which occur.
Since 2018 AWS (Amazon Web Services) has been providing the graphics and real-time analytics for F1, showing information on-screen about pit stop strategies, overtaking opportunities introducing information on the “undercut” and “overcut”, this is where an F1 driver gets an advantage by either taking a pit stop early or later. These graphics are underpinned by clever real-time models which allow viewers to see when a driver is at threat of losing their position due to another driver pitting or not pitting. Since we know how long a good pit stop may take at a particular circuit and we also know the speed advantage of driving in clean air and the performance improvement of the new tyres, these factors can be put into a model (formula) which will take the times for the 2 battling drivers and relate the difference in their projected times after the pit stop has occurred.
AWS shares this model as: “GMAB ≤ (PA – PB) + (PsTA – PsTB) + DA.e”
Where:
GMAB is the Gap between A, B in lap M
PA – PB is the Delta (difference on best time) pace of the cars
PsTA – PsTB: Delta (difference on best time) pace of the tyre compound with reference to soft
To the viewer, this graphic provides an exciting insight which adds an extra element to the race, but it isn’t magic or super computer math. This is quite simply well-structured data used in a model to provide a clean, clear interface, much like many businesses may need to do when running logistics or construction material removal. Factors could be substituted from tyre degradation to carbon footprint. The only difference between the system AWS uses here and the common cloud computing used is that AWS has turbo charged their throughput to be able to run more calculations faster.
Everything happens in the blink of an eye
As we previously discussed, when you have cars zipping around a circuit at 200+mph, you need to have a fast and responsive system. From the moment the signal on the car is sent to the time it is ready to be used by the race director and TV is less than 500 milliseconds. Once a signal is captured at the race track, it begins its journey, first passing through F1 infrastructure to an HTTP call to the AWS Cloud. AWS and F1 used Amazon API Gateway to act as the entry point to the application, which was itself hosted as a function in AWS Lambda to implement the race logic. Once the function received the incoming message, it would first update the race state stored in Amazon DynamoDB (for example, change of driver position). If the function determined that it was a trigger for a prediction, it would use the model trained in Amazon SageMaker to make and return the prediction as a response to the call, ingested back through F1 infrastructure to the broadcasting center.
Simulation is key
How can a driver turn up to a race they have never raced and be quick on day one or how can the engineers know how the car will perform? Quite simply they drive the car around a giant digital twin.
The tracks and surroundings are captured using high resolution LiDAR, ensuring that every bump and visual cue is in the system, this is vital in ensuring the full immersion and accuracy as a driver will complain if they can’t feel the bumps in the track at Monaco or if the turn 3 is 2cm too wide at Silverstone. Teams like Red Bull Racing and Mercedes work closely with gaming companies to ensure that their simulators are as realistic as possible. To put this into context, a new circuit which we’d planned to capture, was planned to use some Leica Pegasus Two Ultimate mobile scanners to drive the circuit, each capturing around 1 million points per second.
These simulators are called “Driver in Loop” (DiL) simulators and as well as the track digital twin that is shown on screens in front and around the driver there is also a cockpit which the driver sits in (sometimes called a tub), which sits on actuators that move perfectly matched to the drivers input.
The simulators are so accurate that different racing setups, weather and even tyres may be used in preparation to race data so that the driver can work on their set up in advance of the race. The simulator takes vast amount of cost away from the mechanical work which may need to be done to get the balance right as the set up can be altered at the touch of a button. Also, technicians can get real-time data back on performance and expected deltas as wells as show playback of areas of improvement.
In the run up to the Silverstone 2021 Grand Prix, Lewis Hamilton announced on the morning of the race that he had finished qualifying the previous day and had gone immediately to the simulator to do a few hours practice, which from what Mercedes has said about the regime they have before a race weekend, the drivers may practice in the simulator for that track for almost 2 days solidly.
The simulators have proven essential to the F1 teams, so much so that every team has one for every driver and test driver. It also provides information to the technicians ahead of a race which may help with strategies and choices. Much of this has begun moving to common business, maybe not in the guise of a race simulator but in the form of highly detailed digital twins which may be tested for real world results. When we look at the automotive industry, they now use immersion rooms which use digital twins of the cars planned to be built.
Geospatial driving mobility
Surprisingly, it isn’t the race itself where the majority of geospatial technology is used, it is in the logistics of transporting the cars, drivers, components and offices to and from the race tracks across the world every couple of weeks.
Logistics providers make extensive use of GIS data, using it to plan delivery routes, for example, and predict arrival times based on weather conditions, congestion, and known delays at ports, airports, and border crossings. Digital twins of will also help providers to optimize their conventional logistics networks, for example by using rich data on customer locations, demand patterns, and travel times to plan distribution routes and inventory storage locations.
When every fraction of a second counts and there are millions of pounds at stake only those who innovate and develop cutting edge solutions will win the season. As mentioned earlier the cutting-edge innovations filter down to everyday business.
If we look at the super-fast blink of an eye response times which are being used by AWS for the graphics and analysis, they are available now, fully ready to be implemented in your business and could be used for many different applications, from logistics through to fleet management and even mapping of IoT sensors. When looking into the AWS solution, there is a wealth of information and is almost ready to go out of the box, there are even prebuilt machine learning and artificial intelligence models which can be implemented.
Although the simulators may not be something every business requires, the way which they are used very much is. Formula 1 has shown the importance of digital twins, from the building of the car through to the circuit and logistics, in formula 1 everything has a digital twin which can be tested to its extremes and more importantly works in harmony with one another.
Like many engineering companies, Formula 1 has realized the gains to be had with digital twins, though it is the extension to other areas of business which has provided the grand prix wins , although the F1 industry use the high-end equipment, that doesn’t mean that this is out of reach for your average business, it is just a case of scaling down to sensible levels, scanning to millimetre accuracy is nice, but is it necessary!
Integrated geospatial technologies, drones crucial for Indian highways
General Vijay Kumar Singh, PVSM, AVSM, YSM, (Retd.), is an Indian politician and a former four-star General in the Indian Army. He is currently Minister of State in the Ministry of Road Transport and Highways. Geospatial Artha had a freewheeling discussion with him regarding the vision and commitments of the ministry, future plans for India’s highway sector, the application of technologies in the development of infrastructure, major challenges facing the sector, and more.
Ministry of Road Transport and Highways: Vision and Commitments
The vision of the Ministry of Road Transport and Highways (MoRTH) is to have a sustainable, efficient, safe and internationally comparable quality of road infrastructure in general, and a national highways infrastructure in particular, to achieve enhanced connectivity and quick mobility to a level that will accelerate socio-economic development.
The primary focus of MoRTH is to develop the national highways (NHs) network in the country into a road network of international standards for uninterrupted flow of traffic, with enhanced safety features. Evolving policies for efficient and safe transportation through the road network and facilitating their implementation is also one of the major focus areas of MoRTH.
Apart from this, improving the road safety scenario in the country, especially on national highways, is of high importance; it can be achieved by promoting information technology for facilitating online services for the stakeholders and strengthening the public transport system.
The future of highway construction
Over the years, the speed of road construction has become the benchmark for India’s infrastructure creation. The Central Government has been trying to leverage roads, railways and waterways to bring India’s logistics costs down to 8% to make the economy competitive.
In the process, the government has revived the highway sector, which was reeling under stress and lack of private investment. The government has also set ambitious plans, such as the Bharatmala (roads), to improve the transport infrastructure.
The total investment for the Bharatmala project is pegged at Rs 10 trillion, which is considered to be the largest ever outlay for a government road construction scheme. With an average speed of 37 km per day, the construction of national highways during 2020/2021 has been the highest ever in the last five years, despite the COVID-19 crisis and months of lockdown. The total length of national highway construction, up to February 5, 2021, was 9,242 km.
Geospatial technologies in Indian highway infrastructure
The government has taken steps to manage national highways and road assets using different geospatial technologies — unmanned aerial vehicles are being used to monitor and manage national highways and road assets.
Satellite data and geospatial technology are useful in providing inputs to highway and infrastructure projects for preparation of detailed project reports (DPRs), pre-feasibility status in new alignment, upgrades and road widening, monitoring of road segments under construction, and for the Road Asset Management System. Drone technology finds its use in monitoring, construction progress, Road Asset Management, feasibility report and DPR preparation, and immediate assessment and remedy of problematic spots.
The following challenges predominantly encountered in roads and highways infrastructure development, can be addressed using geospatial technologies:
Technology adoption
Low productivity
Low profitability
Fragmented data ecosystem
Environmental & sustainable development concerns
Ageing assets
On-site wastage
Increased levels of reworks
Coordination among stakeholders
Lack of real-time status
Digitalization awareness
Skilled manpower
Technology improves workflow and processes
With the Government of India investing significantly in highway construction projects, the need for adopting integrated geospatial technologies is strongly evident — particularly for design-to-execution quality and enhanced productivity.
Advancements in the design industry from 2D CAD drawings to 3D digital models have specifically linked design process, role, and stakeholder. From pre-construction to the operations and maintenance phase, drones have proven to be of use during each lifecycle of a transport construction project. There is a seamless integration and collaboration of resources and stakeholders, with data being shared in real time.
Apart from drones, advancements in 4IR technologies (including Internet of Things (IoT), Big Data Analytics, artificial intelligence (AI), and BIM) create Digital Twins, that is, almost complete virtual replicas of the built environments.
These platforms combine real-time information feeds from various sensor networks and intelligent systems. All these technologies together are playing an enabling role in improvement of workflows and processes related to highway construction projects. Additionally, this will also reduce the silos in project execution, whilst increasing productivity and reducing errors and reworks.
Challenges addressed by geospatial technologies
The Indian highway construction sector faces numerous challenges from project conceptualization to operations and maintenance stage. Despite its prominent stake in the economy and society, the sector’s performance has lagged tremendously behind other industrial sectors in terms of digitalization. Highway construction involves varying levels of complexities from design and engineering to build and maintenance stage.
The build stage in the highways sector has been traditionally plagued by shortcomings in inter-departmental collaborations, adverse environmental conditions, contractors’ non-performance, skilled manpower, equipment breakdown and idle time. In the case of build stage of airport infrastructure, challenges are largely related to change in design/scope and planning in-silos.
Highway infrastructure projects represent some of the major advancements in engineering technology, tipping the scales in many dimensions — size, complexity and cost.
With large-scale investment, design complexities, and lasting impact on future infrastructure assets, these projects are prone to significant project execution risk and massive cost overruns. These challenges are often a result of project data gaps, which lead to significant material wastage, cost and time overruns, and continuous reworks, resulting in massive delays and loss of capital.
Pre-requisites for the successful adoption of geospatial technologies
Though quite a few geospatial technologies have already entered the Indian highway construction industry, there still exist challenges for smoother adoption of these technologies. Some of the common challenges are lack of digital awareness and coordination among stakeholders.
The stakeholders need to understand that application of content-enabled (multi-disciplinary on-site data), connected (near real-time off-site to field collaboration) and constructible workflow (using as-built data) has proven successful in reduction of disjointed design-to-execution workflows.
Integration of on-site technology solutions with off-site platforms changes the outlook of transport infrastructure projects by structuring the available datasets and streamlining the information for an efficient workflow benefitting each stakeholder. These integrated solutions will provide a collaborative approach in integration of lifecycle data, resulting in increased returns on investments and compliance of project time and cost.
1Spatial, the global geospatial software and solutions company, are improving their data submission portal, 1Data Gateway, to further simplify and minimize data handling within their solutions.
Following one of 1Spatial’s key Location Master Data Management principles –Simplify and Minimise Data Handling – many enhancements to 1Data Gateway 2.6 focus on reducing processing time. This latest release has seen the 1Spatial Team adding schema management enhancements to make complex data submissions even simpler to manage, accept and process.
A new ‘schema only’ data store allows you to define classes and attributes without having to upload unnecessary data or connection details, saving processing time and simplifying the use of custom classes. Similarly, a powerful new ‘validate schema’ task gives you the ability to compare the schema of two data stores, without loading the data associated with them.
The newly added ‘schema transformation’ task can define complex mapping between two schemas, transforming classes and attributes as required. Schema mappings are stored centrally and can then be copied between project and assignments, saving time and simplifying configuration. Alongside this, the new ‘open schema’ task can be deployed to allow the upload of files with missing or optional classes, preventing processing errors.
Bob Chell, Chief Product Officer commented: “Simplifying and minimizing data handling has always been high up the list when we build solutions, or advise customers on what to do with our products. After adding a lot of great new features into our rules engine,1Integrate, we had to make sure we gave our portal users access to this capability in an intuitive way. We want to ensure everyone gets a consistent experience across our product set. So now, if you are using 1Integrate, or a combination of 1Data Gateway and 1Integrate, you will get an improved and memorable experience when it comes to schema management and complex workflows”.
Michael Martin, Director of Consultancy added: “I’m really looking forward to sharing the latest 1Data Gateway release with our customers. This brings huge time savings to our Public Safety package when mapping clients’ models to the new NENA GIS Model. The new schema mapping interface provides greater flexibility for the contributor to show only unmapped fields, whilst for implementers, being able to use expanded functionality for opening schemas enables the use of ontologies.”
1Data Gateway is used with 1Integrate to ensure compliance of data for use across the enterprise and provides automated data validation, cleaning, transformation and enhancement. It enables users to assess the quality of data to ensure it meets defined specifications and is fit for purpose.
Indian government's ambitious scheme, SVAMITVA, can be better termed as 'Zameen se Jaydaad tak'. The scheme involves using drones and surveying to map habitations and provide 'Record of Rights' to villagers across the country. Geospatial Artha team traveled to the hinterland of Haryana and Uttar Pradesh to take stock of the ground situation.
By Jitendra Choubey
As he moves his index finger over a white paper chart depicting granular images of irregular-sized housing roofs, curved streets, and community infrastructure, Ram Prasad Saini, a junior officer in the Uttar Pradesh State Revenue Department, claims what he is showing to us are images of Umrala village in the Khurja block of Uttar Pradesh.
This village, located about 100 km east of Delhi, is where he first completed his survey and distributed housing ownership certificates to 300 residents under SVAMITVA — Survey of Villages (Abadi) and Mapping with Improvised Technology in Village Areas, the government’s flagship land reform scheme. The SVAMITVA scheme provides rural people with the right to document their residential properties so that it can be used for economic purposes.
“It is a huge task but drone technology has simplified the complex job of measuring the boundaries of every household,” says Saini. Trained in the conventional methods of land measurement, he seems surprised by the quality of the drone images available now.
“Drone technology is so precise that it leaves no space for human manipulation; we peacefully executed our ground-truthing work based on the map supplied by Survey of India The images are quite persuasive and helped the villagers identify their own places, roofs, walls, and streets. Drones have replaced the conventional surveying methods of chain and tape, which would have otherwise made the task slow and tedious,” adds Saini.
The surveys are part of India’s ambitious rural land reform project, SVAMITVA. Prime Minister Modi has called it one of India’s biggest land reform missions since Independence. Launched in April 2020, it aims at providing clear ownership of property to people inhabiting rural (Abadi) areas so that every homeowner in a village gets housing record document.
Villagers also have records of their agricultural fields, which are maintained and updated by the state’s revenue department because they are a primary source of tax revenue.
“In North Indian states, these agricultural field records are popularly called Khatauni,” says Saini. “Now a new term, Gharauni, has been coined for the house records.”
Before SVAMITVA, rural houses were delineated based on common understanding between neighbors. Villagers usually erected small stones or grew trees to demarcate their houses and land. However, these methods were frequently marred by disputes. Now, under SVAMITVA, the villagers are given accurate housing land records, which not only reduce property-related disputes but are also supposed to help villagers buy and sell property and get bank loans. This will, in the future, also help local governments make comprehensive village development plans.
Source: Ministry of Panchayati Raj
How the surveys are conducted
To start a drone survey, some groundwork is required. With the help of local sanitation workers, government officials put a one-foot wide lime (chuna) powder strip around the designated border of a village, based on maps from the 1960s. This border is officially called ‘lal-dora’ and it circles the land that is formally inhabited by the villagers. This survey does not take into account the houses/inhabitants outside the designated lal-dora boundary.
Next, a drone is used to conduct an aerial survey from a height of approximately 400 ft. Later, the local officials receive a map for ground-truthing. Based on their feedback, a final map is released and after that the villagers receive the documents related to their housing rights.
Ram Prasad Saini (Right), Junior Land Revenue Officer, shows the final map of Umrala village, Khurja block, UP, prepared under SVAMITVA scheme.
Lagging behind target
Today, drones have drastically reduced the time taken by manual mapping and surveying. However, on the ground, the implementing agencies are facing a shortage of manpower to meet deadlines.
Saini too, faced a huge staff shortage to finish executing his task. He took up the job of visiting all 300 homes in village Umrala by foot over a period of two months, writing the owners’ names on each verified roof on the map (in consultation with the villagers), completing ground surveys, finalizing documents with geo-tagging, and distributing them among all the households in the village. He was actually responsible for a total of eight villages that had been surveyed by drones already. Although he finished his work in Umrala on time, the other eight villages are still pending.
The SVAMITVA project was launched in April 2020, with the aim of finishing the survey by 2024 and providing the final property rights documents to all rural households by March of the year. In the current financial year 2021/2022, about 2.3 lakh villages in 16 states were targeted with an outlay of Rs. 200 crore. But, according to the government website, only 1.13 lakh villages have been surveyed ((see ‘Missing Target’) till now and the residents of over 27,000 villages have received property documents.
“If we cannot provide help (more manpower) on the ground, this deadline will keep extending,” says a senior officer, who oversees the implementation of the project, on the condition of anonymity.
Also, there is a lesser availability of drones. Government procured only 300 long endurance drones – capable of staying in air for 1.5 hours, covering up to 5 km of area and producing high spatial level of resolution –from Roorkee-based company Ansari Precision Instruments Private Limited, a part of the Roter Group of Companies.
“Government requires around 2500-3000 such long endurance drones to achieve its target by 2024” says Sajid Mukhtar, Chairman, Roter Group of Companies.
Rajbir Singh, 52, of Devan village, Hisar, Haryana, raises his concern over faulty survey and poor grievance redressal mechanism
Other challenges
Several villagers living outside the lal dora boundaries have complained about their habitats not being included in the surveying and documentation process of SVAMITVA.
According to Saini, this is because only the land inside the lal dora boundary was never documented; the land outside has already been documented by the land revenue department of Uttar Pradesh.
“The land outside the lal dora is either the community pond, land used for grazing cattle, or agricultural land that is already occupied by families and recorded with the government,” he says.
The union government has made the Ministry of Panachayati Raj (MoPR) the nodal ministry to implement the project. But MoPR lacks competency in land related subjects. Keeping this in mind, the Uttar Pradesh Government pressed the Land Revenue Department into service to lead the project. It made the survey more precise and almost dispute-free. But this is not the case in other states, such as Haryana. The Department of Panchayati Raj in the Haryana Government has been carrying out the task but it is marred by many anomalies and disputes.
“The ground-truthing committees in states are not working in a coherent manner, therefore disputes are arising.”
Disputes emerging
Over 200 km north of the national capital, people at Devan village of Hisar district in Haryana are agitated over the survey. They say the drone surveys have generated wrong coordinates of the residents’ homes, as well as those of other village infrastructure and roads.
“How has the ownership of homes been given to people who live 200 meters away,” says a visibly agitated 52-year-old Rajbir Singh, head of a family of 10 members. “This has happened not only to my house but those of several others too,” he says. In addition, a common street in his village has been shown to be a private property and other pathways are shown to be going through people’s homes.
The Chandigarh-based regional center of the Surveyor General of India’s office, which conducted the survey with drones, blames the ground-truthing committee instead of the technology.
“I do not think technical mistakes were made; we used a high-quality drone system with a high precision level from,” says Prashant Kumar, a Deputy Surveyor General at Survey of India who was responsible for overseeing the work in Haryana. According to him, Survey of India used a professional survey grade UAV/drone-based system fitted with Global Navigation Satellite System (GNSS), Inertial Measurement Unit (IMU) and optical sensors, with all accessories and software.
“It is possible that either the lime powder patchwork was not done properly or the ground-truthing committee did not work in consultation with the villagers,” he adds.
Local officials claim these technical mistakes are being addressed at different levels. However, the affected villagers claim the rectification process is taking long, and is expensive and cumbersome.
Local government officials of the District Panchayati Raj department say such cases are small in number. However, a senior officer has a different take on it. Priyanka Soni, Deputy Commissioner of Hisar, says they have solved over 900 such disputes. “The project is new and we are trying to set up a fast grievance redressal mechanism. There are some gaps that will be fulfilled in the coming times,” she says.
The ground-truthing is executed by a six-member team made up of two revenue department officials, the village secretary, Panchayati Raj Department officer, and two social activists. This committee has to verify everything before the final tagging of the house owner.
Ramveer Singh, 70, in Nangla Mohiuddinpur, Uttar Pradesh, holds his 'Record of Rights' document given under SVAMITVA scheme after drone survey
Question of legal validity and sustainability
The SVAMITVA document provided to inhabitants gives them a confirmation of their ownership and a feeling of pride, especially to those who don’t have any other financial support systems except their homes. Every household that our team spoke with desired getting a bank loan based on the property documents.
However, the documents lack legal validity as of now because banks do not treat them as authentic. The reason for this is that whatever is being done under this project is legally not binding. The Government has asked state governments (as land is a state subject) to make laws to give these documents legal sanctity.
One of the main objectives of the SVAMITVA scheme is to monetize these housing properties and trigger an economic revolution in rural India. But banks have a different take on it. Our team spoke to a loan aspirant who wants to start his own business but the bank is refusing to give him a loan.
“This is not a surface property that we cannot seize in case of loan default,” says Anil Siwach, a State Bank of India Manager in Hisar district. “The property’s map should be approved by an authority like Haryana Urban Development Authority,” he adds.
Since the SVAMITVA project has no legal validity, the objective of the project to trigger economic activity in rural areas through loans or property transactions, may not be realised.
“There is a lack of a clear roadmap as to how to go ahead from this point and what the villagers will actually do with this document,” says a senior officer engaged in the implementation of the project in Haryana who did not wish to be identified.
Sirsi village in the Karnal district of Haryana is the first village in the country where the pilot project for SVAMITVA was done in 2020. It was a non-starter.
“Nothing has happened since the people received their property documents in Sirsi village. It is unreasonable to expect help from us” says B S Chahal, District Development and Panchayat Officer, Hisar district.
Conclusion
The project seems well-intentioned and promising in terms of both improving land administration and opening rural land markets. But the question remains whether this project will realize its true potential in helping bridge the rural-urban economic divide, which has emerged in the past three decades after the adoption of the economic liberalization policy.
Welcome to the India Edition. A sense of déjà vu prevails because just 25 years ago ‘GIS@Development’ had debuted as a Geospatial magazine for Indian readers. A mere eight-page magazine grew and became a much sought after magazine for readers in government, industry, academia, NGOs and students. The over time, it spawned many regional editions which finally subsumed into the flagship Geospatial World – a magazine of international repute. Indian news was covered but the need to tell the Indian Geospatial story was always felt.
India is a sub-continent. Australia, USA, Russia and China too are spread across continents but India is different in terms of its geography, population and culture. Cartography, a fundamental basis of geospatial systems, had developed in India many centuries ago and was reinforced and developed further as India became a colony of the British Empire. The British knew that governing a country of the size of India called for the best in science and technology. Survey of India, Botanical Survey of India and Geological Survey of India are a few of those early institutions set up by the British that are still going strong.
In recent times, India has built many new institutions around advances in technology and applications. However, geospatial applications remained fettered by ancient laws that hindered instead of enabling a developing nation. A year ago, the Government started a move to overcome this limitation by introducing radical changes. Simultaneously, it has created an environment that takes key technologies like Space out of the sole ambit of Government departments and institutions and encourages private industry and young entrepreneurs to take the plunge into these exciting areas through many new policies for Space, Geospatial data, Data acquisition and applications. While the government has so far funded these activities, now funds are coming from private and angel investors as well which flow to industry and entrepreneurs.
India has a tradition of applying technology to leap-frog into a modern world. Having studied the experience of other nations in applying technology, India is able to build on this and come up with unique solutions for its unique problems. Thus the technologies of Space applications in communications, broadcasting, position location and timing and remote sensing were adopted in various departments and enterprises to improve their functioning and enter new areas. Advances in digital technologies have also given rise to sea changes in the way institutions and individuals communicate, share and transact business. Digital and Space have become so intertwined that it is difficult to separate the two.
SVAMITVA and DILRMP are typical example of how digital technologies, Location and Remote Sensing are coming to the aid of solutions for the ages old problem of delineating properties. The future for Geospatial systems in India is bright. There are enough and more problems to be solved. The key is to remember that what is needed are solutions and not only technology per se.
Geospatial Artha will, every two months, bring stories of ideas that will drive India forward. Stories to energise and enrich our readers.
Smartphone navigation apps have given people a greater sense of personal freedom, allowing them to efficiently venture from one unfamiliar place to another, still knowing where they are. That sense of knowing can quickly fade once someone has arrived at an airport, corporate campus, or medical center complex. While a global positioning system (GPS) can’t find a doctor’s suite or help medics locate an apartment inside a building, an indoor positioning system can. To meet this demand and bring new understanding of indoor use patterns to improve operational efficiency, Esri, the global leader in location intelligence, has launched ArcGIS IPS. The new product will enable organizations to add indoor location services across their facilities and campuses.
“Indoor positioning systems solve the ‘last mile’ navigation challenge, bridging the gap between outdoor and indoor worlds,” said Jack Dangermond, Esri founder and president. “We are pleased to offer this important capability that is another piece in completing holistic mapping systems for organizations that aspire to the digital transformation that geospatial technology provides.”
Indoor positioning systems are a consequential leap towardsmart cityefficiency and convenience, bundling features for managing facilities and monitoring them for conditions that might affect safety and security. The arrival of this technology is also timely. The world’s inventory of indoor square footage is expected to nearly double by 2060, according to the United Nations’Global Status Report 2017. Public safety departments and other first responders will need to navigate indoor spaces quickly to maintain response times.
With ArcGIS IPS, maintenance workers can review service requests to immediately identify and navigate to a location inside the building where repairs are needed. To report a new issue, they can log in and mark their position, making it easier for other team members to find that location for follow-up work. As an additional benefit, this type of automation reduces errors that can occur with manual reporting.
ArcGIS IPS enables real-time indoor location services through Esri’s ArcGIS Indoors mobile application and in custom apps built withArcGIS Runtime SDKs. To implement the system, Bluetoothbeacons, also known as iBeacons, are installed inside buildings. These small, one-way radio transmitters send out information that gets picked up by mobile devices. Esri’sArcGIS IPS Setupmobile app collects radio signals to locate user mobile devices. The user’s location displays as a blue dot on the ArcGIS IPS map, the same way it might display in familiar GPS navigation apps.
In addition to real-time indoor wayfinding, ArcGIS IPS provides GIS teams, facility managers, and senior executives with location information data capture and analytics. Within hybrid workplace models, these tools are increasingly in demand for managing flexible seating arrangements and sharing individual user locations. This creates transparency for identifying on-site staff and improves safety for in-person workers. As with smartphone navigation apps, mobile device users can choose to turn on location sharing or opt out.
SpaceChaintoday announced the completion of the testing of the space node it created forVelas Network AG, which is hosted on an LEO satellite and independent of terrestrial networks. The space node is now capable of delivering the full functionalities designed for Velas, including transaction signatures,smart contract deployment, decentralized finance (Defi) activities and non-fungible token (NFT) minting with the seamless transaction of the Velas Token (VLX).
SpaceChain has assisted numerous blockchain customers to deploy space nodes and realize their space-based business operations through its commitment to utilizing space technology to help blockchain applications gain more application scenarios. SpaceChain will continue to invest in research and development to help reduce the time required for space node testing, expand application scenarios, and enable more blockchain companies to harness space as a platform for business innovation.
The space node was installed onto a satellite designed and manufactured by Spire Global,which managed thelaunch missionon January 13, 2022.
The mission marked SpaceChain’s successful integration of Velas, the world’s fastest Ethereum Virtual Machine (EVM) blockchain and open-source platform for decentralized applications, with its payload. The space node now supports and enables Velas to advance the development and deployment of its blockchain platform, which aims to be one of the most secure and fastest platforms in the industry.
“Through this mission, the space node helps Velas’ blockchain project realize the digital transaction signature service in space, enabling Velas to execute its space services based on this space node,” said Zee Zheng, SpaceChain co-founder and CEO. “With its independence,physical security in space and as a trusted third party in blockchain applications, the space node provides impartial third-party reviews, security protection and other functions to further develop blockchain technology. This implementation improves the credibility and security of its internal system, thereby winning the trust of more market users.”
SpaceChain and Velas are extending their partnership to send another space node to the International Space Station (ISS) later this year. Upon installation and testing, the Velas space node will benefit from the secure and conducive environment provided by the ISS to create more space-based use cases over time.
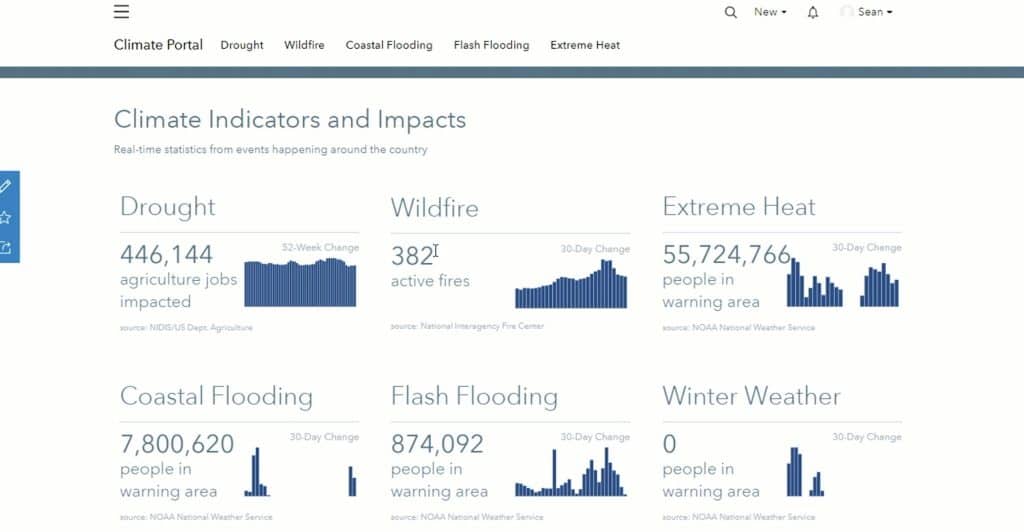
The US government is working on building a climate resilience portal that seeks to bring together all valuable information on climate change and its impacts under one umbrella. David J. Hayes, Special Assistant to the US President for Climate Policy, revealed this at Esri User Conference 2022 underway at San Diego.
“Much of which already exists in various websites, many of them on different federal agencies, websites. But which can be hard to find and put together. But because climate change is impacting [everything] in such a dynamic way, we need to not only know what’s happening now, but we need to project into the future. And that’s one of the most exciting things about a potential portal,” he said as part of his keynote address.
The portal will not only host the data — both, the information that’s happening now and happened in the past — but also combine it with the advanced modeling tools to project different scenarios for government agencies, businesses and even communities to plan ahead. The government is collaborating with Esri for this project.
“It’s not easy to put such a portal together. Nor as a general matter is it easy for the federal government or state or local governments to take on climate change. Because, as you know, there is no federal or State Department of Climate or Department of Climate Resilience!”
Hayes’s address focused mainly on President Joe Biden’s ambitious climate agenda and how geospatial and mapping tools are integral part of addressing those issues.
Because how overarching the impact of climate change has become in every sphere, Hayes explained that addressing the issue today is every agency’s mission, and there is a whole-of-government approach to climate.
“It’s why the President established the White House Climate Office in which I sit and the cabinet-level National Climate Task Force that we work through. And it’s why we have formed a half dozen impact-specific interagency working groups to develop cross-agency strategies to address the drought, the extreme heat, the floods, which care not for agency jurisdictional boundaries. And it’s why the President has unleashed the power of the White House and so many of my fellow feds are here today from USGS from NOAA, EPA, HHS, DOD, NASA, and so many other agencies that use GIS tools with guidance from the Federal Geographic Data Committee,” he said.
The Task Force is now responsible to follow climate data and tie it to geography and provide mapping tools that would help all Americans in all communities respond to and fight climate change. “And that’s why so many of you in state and local governments, and in large and small businesses, and non-profits, are equally passionate about being here today. And why you are so central in creating GIS mapping tools that will help us meet the challenge posed by climate change.”
Hayes underlined three core actions as part of the agenda – one, reduce greenhouse gas emissions that are causing climate change; second, accelerate the transition to a clean energy economy; and third, make communities more resilient and adaptive to climate change. He also highlighted two cross-cutting imperatives — engaging with the entire global community and advancing equity by coming up with climate solutions that acknowledge that disadvantaged communities have borne the brunt of historical environmental injustice and now are being disproportionately hurt by climate change.
“And geospatial mapping tools may be the most important weapon that we have to fight against climate change,” he stressed.
Reducing emissions
“Take methane gas emissions from oil and gas operations. These emissions are not visible to the naked eye, but thanks to new technology, it’s now possible to identify, trap, track, map and stock destructive methane emissions,” he said, while giving the example od Carbon Mapper, the non-profit engaged in data collection and geospatial mapping efforts to locate and track methane and CO2 emissions from air and space.
“We know that our trees, our grasslands, and our wetlands, capture and take up and sequester CO2, removing it from the atmosphere and in effect, helping us achieve net reductions in greenhouse gas emissions. And restoring our forest and wetlands can help take a big step in reducing CO2 from the atmosphere. So, is it possible to see these carbon gains and losses on our landscapes? Yes, through maps,” he said, while highlighting use of satellite imagery, particularly the Landsat program, in monitoring changes on Earth.
The Landsat series, which just completed 50 years this June, has been vividly documenting land cover changes on Earth over time, and the program got a boost last year with the successful launch of Landsat 9.
Hayes revealed that it was this connection between conservation and climate that prompted President Biden in his Climate Executive Order to establish the goal of conserving 30 per cent of the land mass and 30 per cent of our oceans to help combat climate change. Called America the Beautiful, initiative is a Department of the Interior project that seeks to restore, connect and conserve 30 percent of lands and waters in the country by 2030.
“But the President’s goal of conserving 30 percent of our land mass extends beyond protected lands to cover working lands as well. That farmers, ranchers and foresters are managing in a responsible way to conserve carbon and provide other benefits,” he said, adding that the USGS now has a new task to create an American Conservation and Stewardship Atlas that will extend beyond protected lands and start tracking conserved, working lands too.
“Once again, we are looking for common ground that many people can get behind. We need to see it, to feel it, and to find it on a map,” he said.
Transition to a clean energy economy
Smart maps are needed here too. “We need to know the strength of the offshore wind resource off the Atlantic coast in the United States, so we can put offshore wind turbines in the optimal location,” Hayes said.
There was also a need to be smart about avoiding conflicts as we lease those offshore waters, he said while pointing to a set of cadastral maps by NOAA of best places to lease. A successful case was when the land off of the New York and New Jersey shore that had been deconflicted was leased off for USD 4.3 billion.
This map of extreme heat shows the areas where we could expect higher uses of our needs for energy and also impact human activities.
“This is a new industry that’s taking off. It’s getting a good start because of good mapping,” he said, adding that likewise, for the solar projects being built in the Mohave Desert, the Renewable Energy Conservation Plan relied on maps to find the best areas.
“We need tens of thousands of new miles of transmission lines in the United States to unlock renewable energy resources we have in the great Plains and in the arid mountain west. How do we find the best place to put those lines? Again, maps,” he said.
Hayes also underlined the value of geospatial mapping for setting up charging stations to roll out the National Electric Vehicle Infrastructure (NEVI) Formula Program. “Congress has given us more than $10 billion to put in new charging stations. Where should they go? We need the help of transportation experts, driving experience experts, and maps to get there,” he said.
The NEVI formula program established by the Bipartisan Infrastructure Law, provides for funding to designated EV Alternative Fuel Corridors to serve as the backbone for the national electric vehicle charging network. With 249 new designations, corridors now cover 85% of the National Highway System.
Last week, the Department of Transportation also announced a set of measures to help states and municipalities to track and reduce greenhouse gas (GHG) emissions. The new rule seeks to establish a national framework to track state-by-state progress by adding a new GHG performance management measure to the existing national performance measures of the Federal Highway Administration to help states track performance and make more informed investment decisions.
Climate resilience
Communities need to be made more resilient and adapted to the climate impacts they are already are facing. The past few years have seen rise in extreme weather events — massive floods, extreme heat waves, severe coastal erosion — which experts are directly attributing to climate change.
During 2021, there were 20 separate billion-dollar weather and climate disaster events across the United States. The total cost from these events of 2021 was USD 152.6 billion, which is the third most costly year on record, behind 2017 and 2005. According to NOAA, the total costs for the last five complete years (USD 788.4 billion) is more than one-third of the disaster cost total of the last 43-years (1980-2022), which exceeds USD 2.275 trillion.
“Helping Americans cope with these climate impacts that are hitting us in the here and now may present the greatest near-term challenge for us. These climate impacts are taking lives and livelihoods from Americans every day and others throughout the world,” Hayes said, while handing over the stage briefly to Sean Breyer, Manager of Esri’s Living Atlas, to provide a quick walkthrough of how sophisticated GIS mapping gathered together in a broadly accessible climate resilience portal could give citizens vastly more information about the threats their homes and businesses face now and projected into the future, to floods, wildfires, coastal impacts, drought and extreme heat.
for energy and also impact human activities.
This map is extreme precipitation allows us to look at areas that are expected to see increased rainfall over shorter durations of time that could lead to flooding
Justice for disadvantaged communities
In his Climate Executive Order, President Biden established the Justice40 Initiative, which seeks to ensure that ensure that federal agencies work with states and local communities to deliver at least 40 percent of the overall benefits from federal investments in climate and clean energy to disadvantaged communities.
“So how do we identify and locate the disadvantaged communities and check on where the benefits are flowing?” Hayes asked. The answer is obvious — smart geospatial maps.
The White House’s Council for Environmental Quality has put together a climate and economic justice screening tool that identifies disadvantaged communities as tested across multiple criteria. Including climate impacts, access to clean energy, clean transit, affordable housing, clean exposure et al. The project is in data testing currently, and Esri has put it on its platform the seven criteria data layers that are used in the screening tool to facilitate its use.
“The stakes here for climate couldn’t be higher. One measure is the economics with those extreme weather events of last year — those USD 145 billion. They only tell part of the story — the human suffering is disheartening. But we do have the funding and we need to spend our money in a smart way,” Hayes said, adding that for every dollar of spending that is put on the front end – the preparedness — USD 10-11 are saved on post disaster planning.
As part of the Bipartisan Infrastructure Law, USD 50 billion has been allotted for climate resilience.
Hayes ended his talk by reiterating that good information is integral to do the right planning in the right way and in the right place. And that’s where geospatial mapping comes in.
“So, let’s spend this money wisely at the local level where one size does not fit all. Where disadvantaged communities in particular have to be paid attention to. So, all of you, fellow believers in the power of mapping, let’s raise our game. Let’s show where the common ground is and let’s beat climate change.”
Mapping is about maps. But it takes a Jack Dangermond to think of mapping as a strategic activity. “Mapping has a strategy. And to create common ground, we really need to create an agreed upon understanding,” Dangermond said, while explaining the theme for Esri User Conference 2022 (ESRI UC 2022).
This year’s conference, which returned to in-person mode after two years, kicked off at its usual venue – the San Diego Convention Center – on July 11 with the theme “GIS – Mapping Common Ground”.
“This is familiar territory for most of us, especially if you work in communities. You get the community together, you get all the stakeholders together and you talk about issues, and you create a foundation for positive action,” he explained.
“Our world, as we know it, especially those with geographic science and ecological backgrounds, understand it as a complex and highly interdependent ecosystem. Not just the natural world, but also our human world. And many aspects of it are fragile. It’s also rich in biodiversity. It’s also not so well known. We think we know a lot about it, but it’s also not well known and it’s even less understood,” he said.
And this world we are living in is changing rapidly, and increasingly because of “reckless” human activities, which is causing us to fall out of balance with nature. Issues like human induced climate change, overpopulation, congested cities, pollution, and careless development have set in motion a whole series of conflicts and instabilities. Steep declines in biodiversity are leading to increasing natural disasters, changing and challenging the very sustainability on our planet, and actually threatening our future.
“The central problem of this is not just any one of those issues. It’s the lack of understanding of the intricacies of these issues and also their interrelationships. Further, our inability to actually collaborate and work on [is adding to the complexities],” Dangermond said, stressing that mapping and the geographic approach are powerful means to create understanding and collaboration.
“Finding solutions, reaching agreements, mapping common ground, a foundation for positive action. And I’ll repeat the words, creating agreed upon understanding,” he underlined, while stressing upon the need for increased collaboration.
Mapping is likea language
Stating that mapping is like a fundamental language, and like the written language or mathematics or music, it’s amazing as a language for telling stories. “It helps us understand and collaborate too. It allows us to communicate our stories. It allows us to plan and sketch. Mapping is not only describing what is, but also what could be, and this sparks our imagination. It’s been an instrument for this activity for thousands of years.”
History shows us that historic remnants of mapping were instrumental for progress in civilization – from navigation, to discovery, to organization, and even land organization. And as the technology is rapidly advancing, it can have a much more major impact on the way human civilization will evolve.
“I’ve began calling this ‘the geographic approach’. It’s really an old thing, but I like these words — the geographic approach – as a way of thinking and a way of problem solving, bringing it all together,” Dangermond explained.
For instance, the geographic approach to education, the geographic approach to planning, the geographic approach to business, the geographic approach to energy — all of these various works that we do have a basic geographic approach. And it is interesting because all this driven by data, which is based in science and is inclusive.
“Getting all the data, visualizing it, analyzing it, planning on top of it, designing strategic thinking and acting on it. That is Mapping common ground,” he explained.
Technology advancements
Advancements in technology is also leading to advancements in analytics and visualization, and ultimately the storytelling. And as systems become interconnected, it is enabling something that we are starting to call geospatial infrastructure. Just like the Internet and World Wide Web, geospatial infrastructure is opening up a whole new system of systems platform for us. And, as millions of users begin to use this system every day, sharing tens of millions of data sets, they are further adding to the data and helping build this infrastructure. There are now over 50,000 websites with sharing hundreds of thousands of open data sets engaging with people, he said.
Dangermond also made a special mention to the GIS and geospatial community’s contribution to managing the pandemic crisis. “It touches me actually what you did during COVID. Over 8,000 deployments of the dashboards to track COVID and then also track vaccinations. The heroes in here.”
The greatest and perhaps most impactful use of maps in recent times has been the John Hopkins map on coronavirus which has had a total 1.2 trillion views. “That map told everybody what’s going on. As people could understand the crisis better, they could collaborate and respond efficiently,” he said.
“And I believe this is key for the future. [As a community,] we must all do everything to address these challenges we are having. And it’s kind of a key for mapping common ground at all scales,” he added.
From health to conservation, city planning to engineering, mining, energy, water and wastewater management, disaster management to commerce and supply chains, GIS and mapping have become integral to all workflows and businesses today. Thousands of organizations around the world are embracing GIS as a foundation for everything they do.
“GIS is helping in social equity and become a foundation for looking at vulnerable populations for example, in healthcare like in New York City, or transit access to social, vulnerable communities, or looking at power plant emissions and environmental justice by the US EPA,” he said.
The awards
This year the Making a Difference Award went to the Southern California Association of Governments for assembling from across 192 different departments all the information to create a regional information system.
The Enterprise GIS Award for this year went to Ordinance Survey (OS). Calling it one of the most sophisticated mapping organizations, Dangermond explained OS has built a database of half a billion features in the UK, which is updated 20,000 times a day.
This year’s President’s Award went to Prague. Like every place on Earth, one of the biggest challenges the city is facing is climate change. It has seen substantial change in the weather and climate in the last years. As the number of heat waves increases, it also negatively affects the environment — poor health of trees, poor health of grass in the parks, as well as negative impact on the health of the elderly people.
The mission of Prague’s Institute for Planning and Development is to improve the quality of life for through intelligent planning. The institute is using satellite imagery, and by combining with data layers such as population density and planning regulation etc., it is locating the spots that lack green cover. The city uses this data to build new green roofs, plant new trees, or even add new water features.