Esri’s Dawn Wright Answers Questions About the Next Critical Geographical Challenge Scientists Face
Ocean waters cover 70 per cent of our planet, and yet just one-fourth of the seabed has been mapped in high resolution to date. If we don’t fully understand how the ocean works, we can’t protect it (or ourselves).
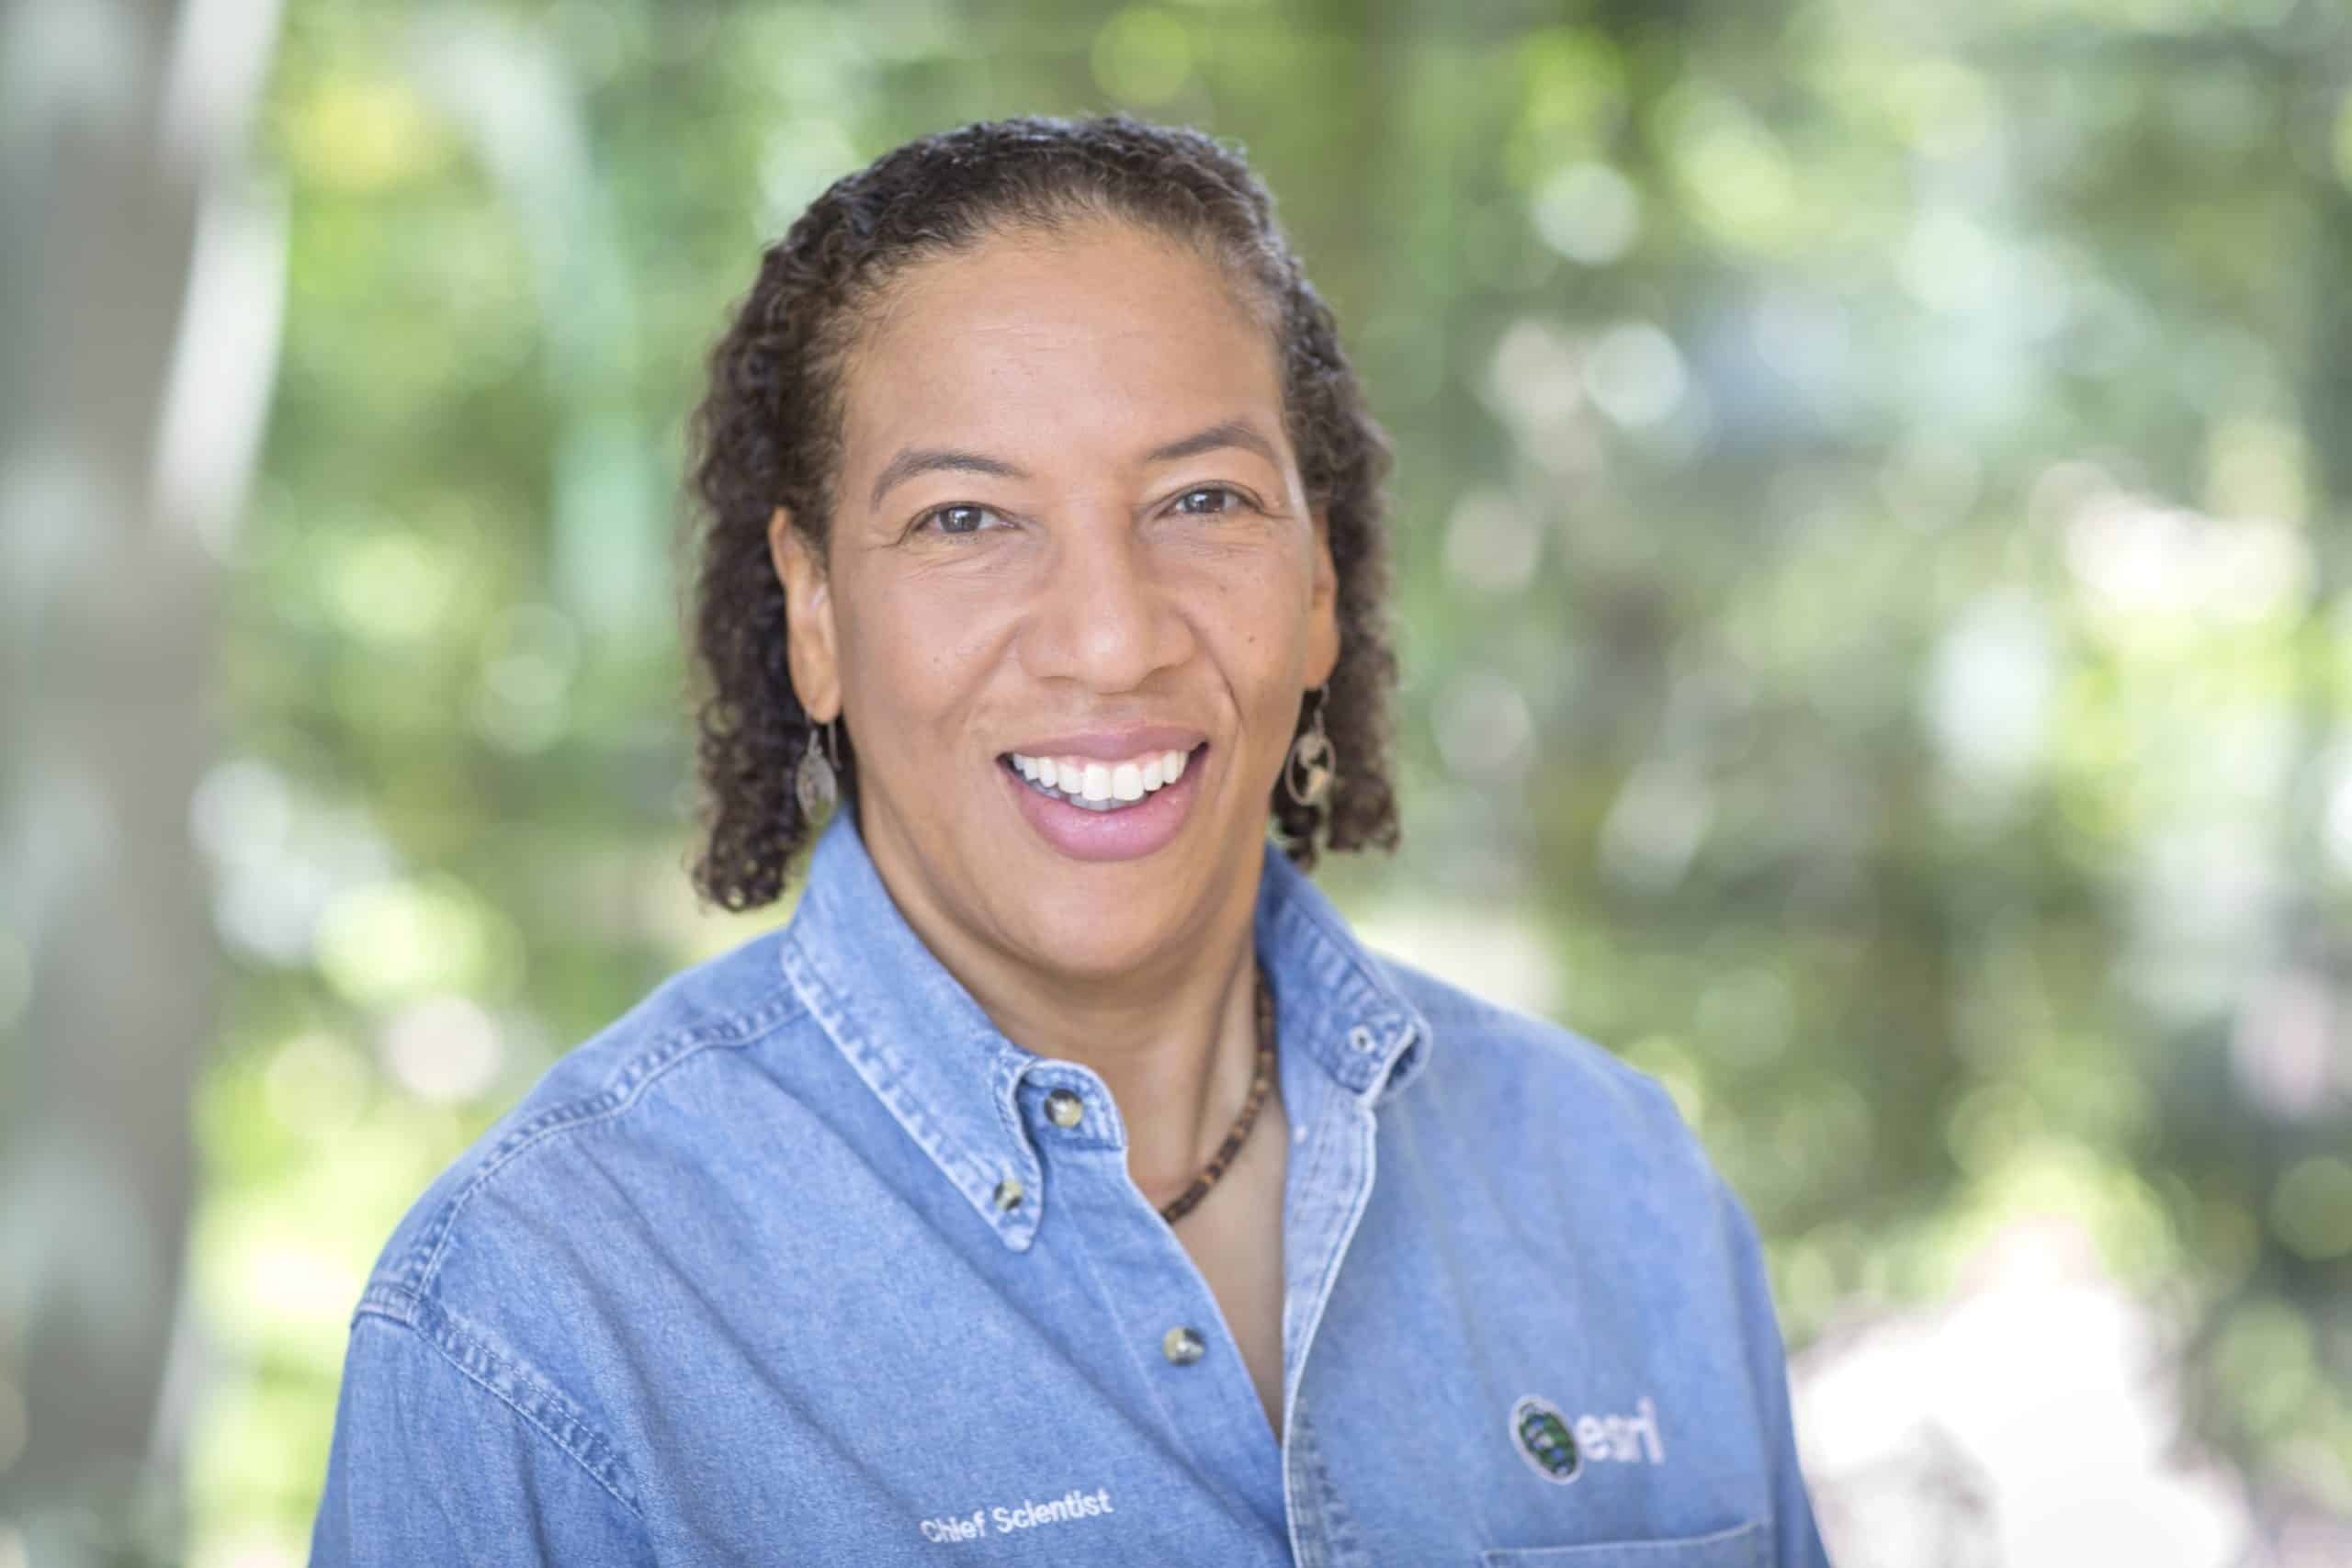
That’s why distinguished oceanographer and chief scientist of Esri Dr. Dawn Wright has dedicated her life to exploring the ocean, studying its biology and geology, and mapping its depths.
How can mapping the ocean floor inform our understanding of what happens on the surface?
We now know that the planet’s surface is made up of tectonic plates, major and minor, that ride on top of Earth’s mantle—essentially a layer of hot roiling rock. The plates fit together like a jigsaw puzzle, but, because the mantle is moving, they don’t stay put: They’re constantly shifting, sliding, and grinding into one another.
The seams between them, where they collide or push apart, are known as faults. Just like on land, where a sudden slip along a fault can cause an earthquake, undersea faults are hot spots of geologic activity, generating earthquakes and volcanic eruptions on the Earth above. But high-resolution seabed maps can help scientists predict catastrophic events like these before they happen.

Tsunamis come about as a result of a movement on the floor of the ocean that’s expressed in a fault. That’s why we need to monitor those fault zones, but even more importantly, we need to understand the shape of the seafloor in coastal areas where tsunamis occur.
The ocean is a potential resource for energy that doesn’t rely on fossil fuels. How can seabed mapping bolster initiatives for emerging alternative energy technologies?
We’re looking more to the ocean now for energy—wave energy, for instance, or wind energy. And we are setting wind turbines on the ocean floor. So we need to know what the ocean floor looks like—which areas are flat, for instance, and what is the composition of those areas.
Siting wind turbines involves a host of other considerations. Among those is ensuring that the turbines won’t harm endangered marine species, such as the North Atlantic right whale. With the right geospatial data, we can begin to answer crucial questions, such as, how do we ensure that while building out this renewable energy source we are also preserving the right whale?
How are we going to know that the wind will be there in 30 years? Accurate maps and spatial models can guide scientists to make the best decisions for our energy needs as well as for the ocean ecosystem.
Speaking of preserving marine ecosystems, we rely on the ocean for much of our sustenance. Do maps provide a pathway towards sustainable fishing practices?
According to the Nature Conservancy, fish and other seafood products provide essential nutrients for more than 3 billion people around the globe. Much of that much-needed protein is swimming around the ocean floor, especially near seamounts, so we need accurate mapping to monitor and protect the habitat of those fisheries.

If scientists have a clearer picture of life beneath the surface, they can do a better job of managing marine fish resources, making sure that local fish stocks aren’t depleted, and protecting vulnerable species from overexploitation. Almost 90 per cent of global marine fish stocks are already fully exploited or overfished, according to the World Bank, so this is an urgent problem that accurate ocean mapping can help address.
Of course, protecting marine habitats has value over and above its immediate utility to humans. An estimated 50–80 per cent of all life on Earth is swimming, crawling, and wriggling beneath the surface, and scientists have identified only about 250,000 species so far—with as many as 2 million more still to go.
Much of your work and writing focuses on the crucial importance of the ocean to the issue of climate change. How is seabed mapping part of the solution to this daunting challenge?
Coastal inundation (flooding) poses a significant threat to millions of people around the world, especially in small island nations, and that threat will keep rising as sea levels rise. The global mean sea level has risen about 21–24 centimetres (8–9 inches) since 1880, a trend that is accelerating as the Earth heats up, melting huge glaciers and ice sheets.
This is bad news for people living in densely populated coastal areas; in the US alone, that’s almost 30 per cent of the population.
If scientists have good information about the shape of the seafloor and the nature of the coastline, they can more accurately predict how inundation will affect low-lying areas—and take measures to protect those coastal communities before it’s too late.
(DISCLAIMER: This is an excerpt from Dr Dawn Wright’s upcoming new book “Mapping the Deep: Innovation, Exploration & the Dive of a Lifetime,” from Esri Press. This has been published with due permission from ESRI.)