Central Arkansas Water (CAW) needed an efficient solution to minimize operational expenses and spend capital dollars effectively to remain viable at affordable rates. The solution was likely to be complex, requiring finding ways to maximize the use of siloed data to increase knowledge and understanding of CAW’s current and future needs in a reliable and repeatable manner. Surprisingly, the solution was found in a most unassuming locale — the GIS department.
Central Arkansas Water (CAW), a water utility company located in Little Rock, Arkansas, in the United States, provides potable water services to approximately 500,000 people in 23 communities, utilizing two supply lakes, three treatment plants, and over 2,600 miles of water mains within a 720 square mile service territory.
Its GIS department consists of only seven of CAW’s 323 employees, who work hand-in-hand with Pulaski Area Geographic Information System (PAgis) — an independent government agency ‘housed’ within CAW’s administration building, in immediate proximity to CAW’s GIS department. Both units provide overlapping map and location services under a single manager to maintain base map data for area utilities and governments; the data is used to provide the location for public improvements and related information, including water lines, property boundaries, streets, storm water facilities, property ownership, etc.
When combined with the information from CAW’s many department databases and customer accounts, as well as other public databases, the location data takes on a whole new level of usefulness. CAW’s GIS department reorganizes all that data into easily interpreted charts, maps, and dashboards, which help the organization to quickly make informed decisions.
Making location data accessible to all
At the most basic level, high-quality near-real-time data is available to every distribution crew in the field on utility-provided iPads. This information is priceless to the field personnel who may need to quickly locate the right valve at 2 am in the pouring rain before making repairs to the hospital losing water pressure or the school needing to open its doors to students in just a few hours.
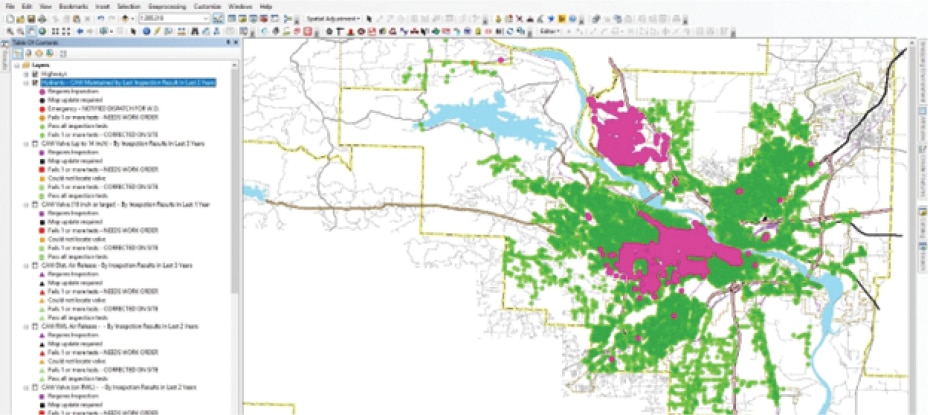
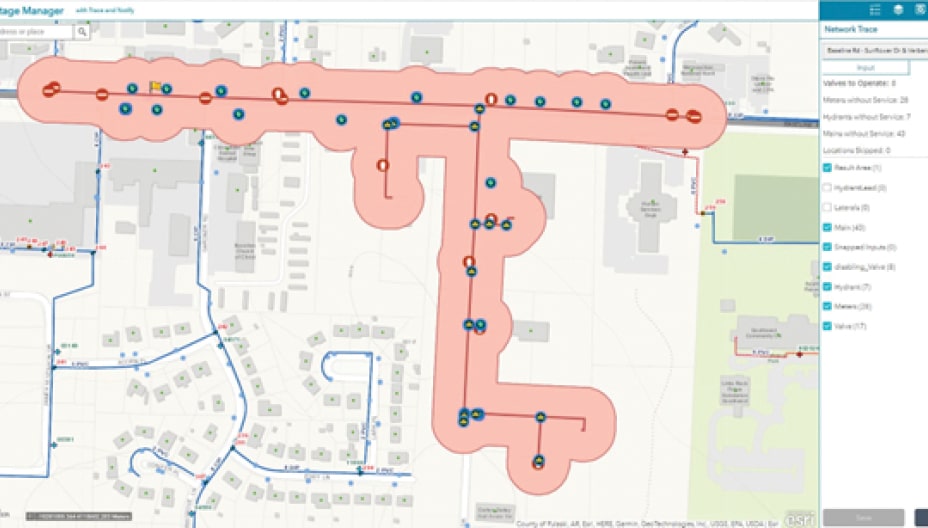
How can CAW and local fire departments efficiently inspect and exercise all 13,000+ fire hydrants twice a year and each of the 40,000+ valves on a regular schedule? Using the GIS located hydrants and valves, combined with the relevant identifying information such as make, model, and left or right turn, CAW’s GIS department has developed an interactive map (see Figure 1) that enables crews to locate each appurtenance, know whether it has been inspected and exercised, indicate when it has been inspected and exercised, and, when necessary, create work orders in an efficient manner. A pilot study demonstrated that GIS’ solution saved the utility over USD 1,000,000 each year, by enabling CAW distribution crews to efficiently perform the work without assistance from any third party.
Tracking crews on the ground
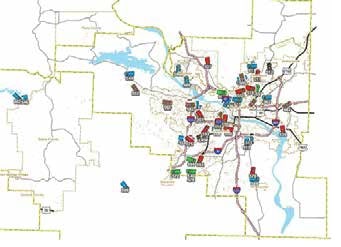
CAW also uses MarshallGIS LiGO GPS trackers on utility vehicles. By displaying each vehicle’s location on ArcMap (see Figure 2), supervisors can quickly locate crews and efficiently route trucks to respond to emergencies.
Critical vs aged infrastructure
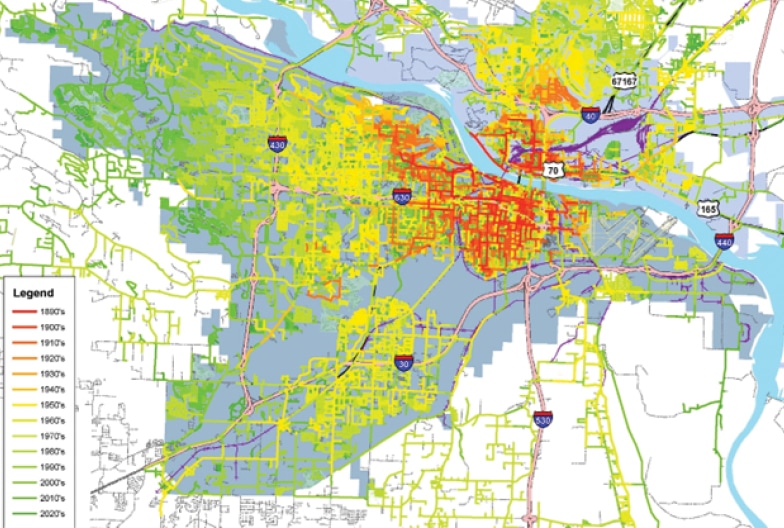
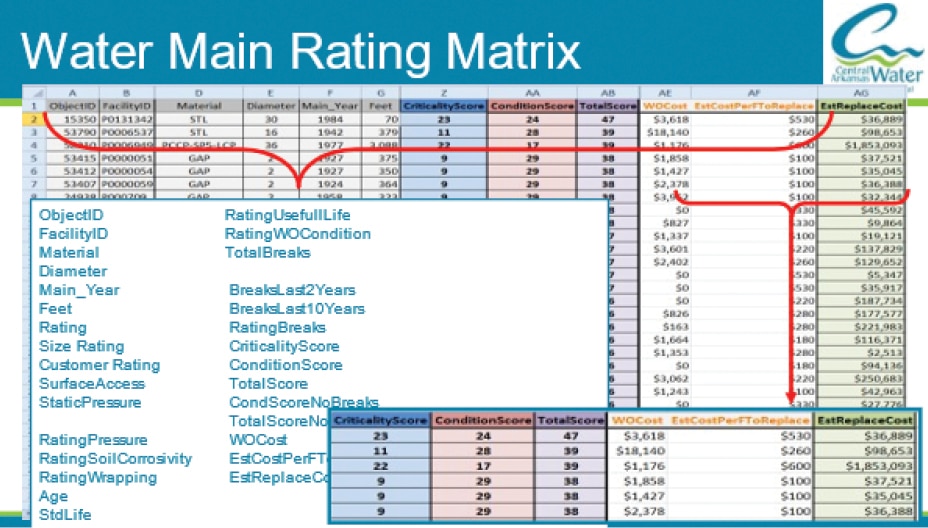
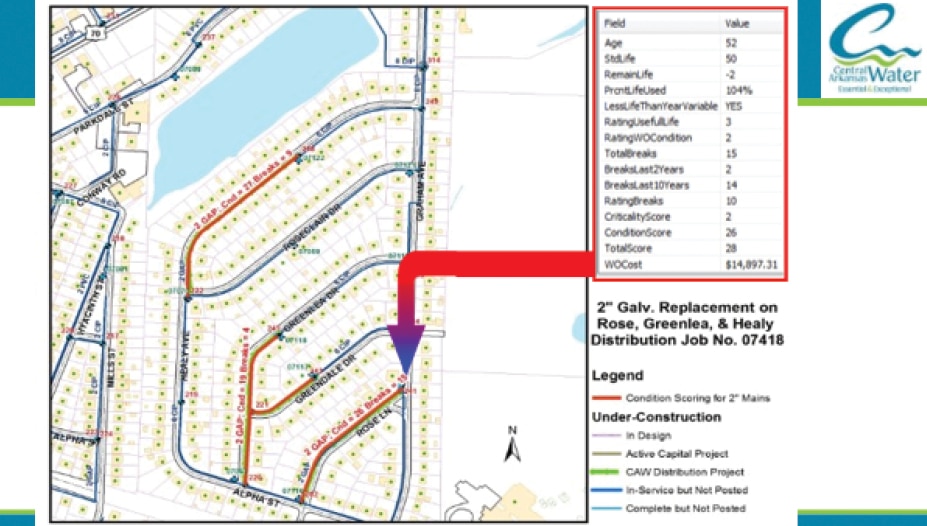
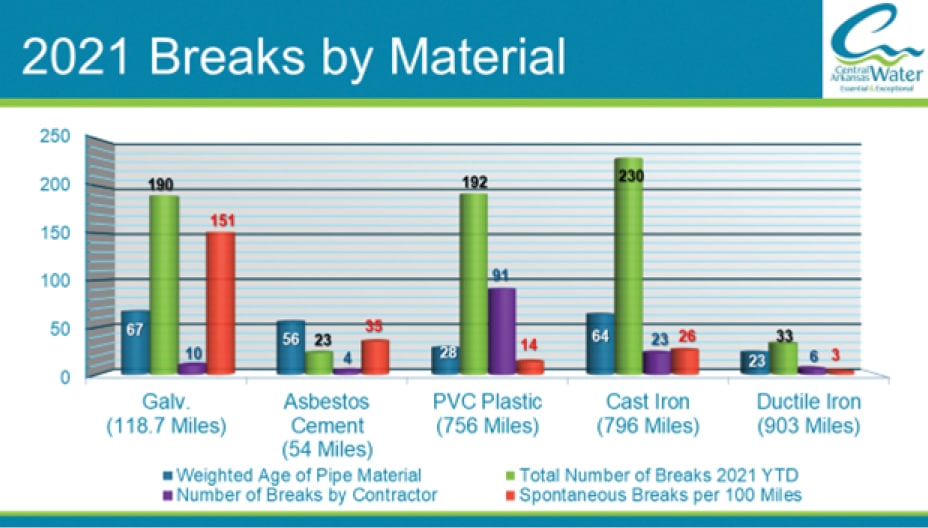
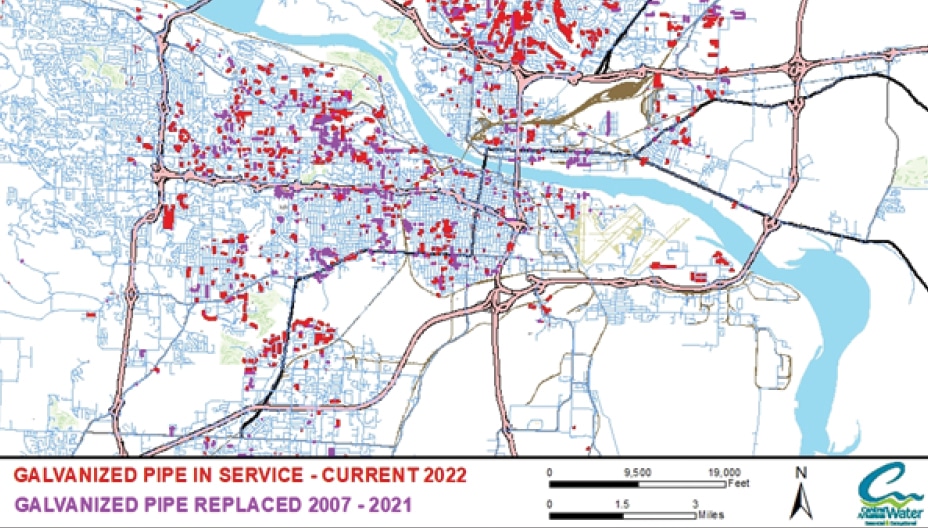
Sometimes information can be misleading. Using installation date data, CAW created an ‘aged infrastructure’ map (see Figure 3), thinking replacement efforts would need to be focused on CAW’s oldest underground infrastructure. However, when combined with other data like asset work history from CAW’s work management system Cityworks, the GIS department was able to develop an asset management matrix correctly — refocusing efforts on critical infrastructure (see Figure 4) and CAW’s newest, but galvanized, pipe with a significantly higher failure rate than the older pipe (see Figures 5, 6, & 7).
Ensuring water safety
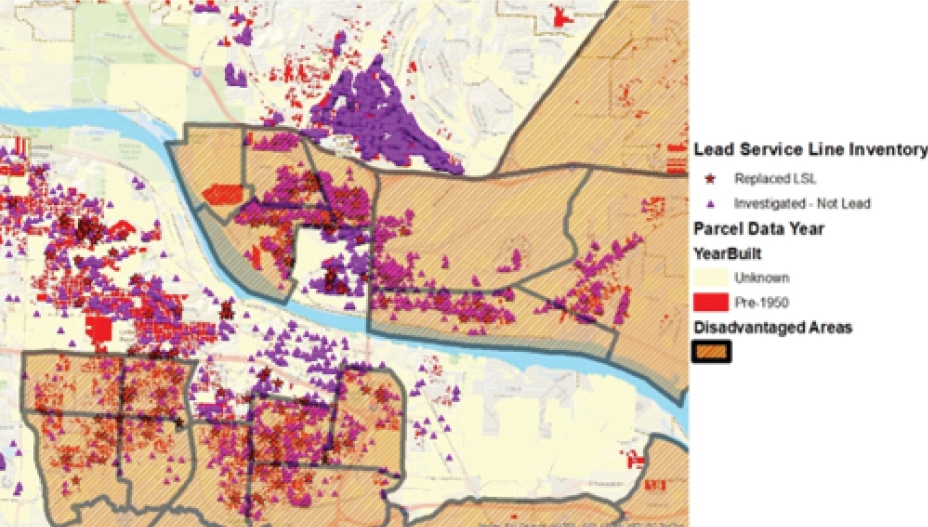
Almost every utility is concerned about lead services lines and the galvanized pipe downstream from a lead service line. Combining multiple pieces of information from various sources, GIS was able to efficiently plot the location of every potential lead service line or galvanized service line downstream from a lead service line (see Figure 8).
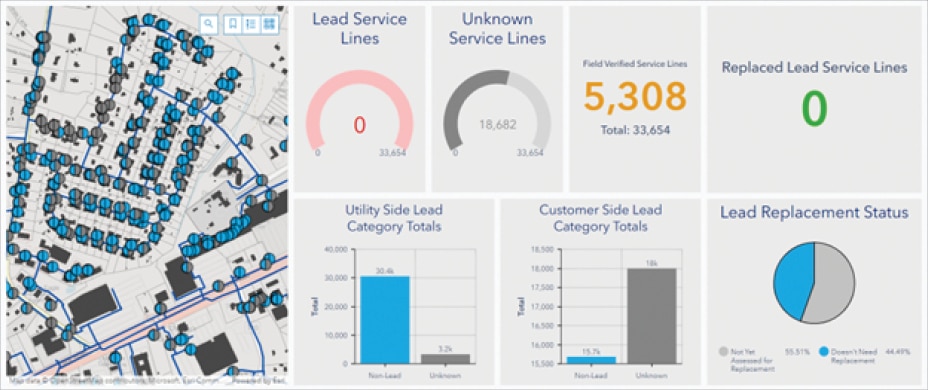
Distribution and water quality staff were then able to investigate each line, establish a reliable inventory, and determine the appropriate action required under the new lead service line (LSL) rules. In addition, CAW staff is developing a dashboard to display near real-time information about the presence or absence of lead service lines, or the lack thereof, promoting efficient operations and supporting public outreach with accurate information to calm concerned ratepayers (see Figure 9).
Preserving water quality
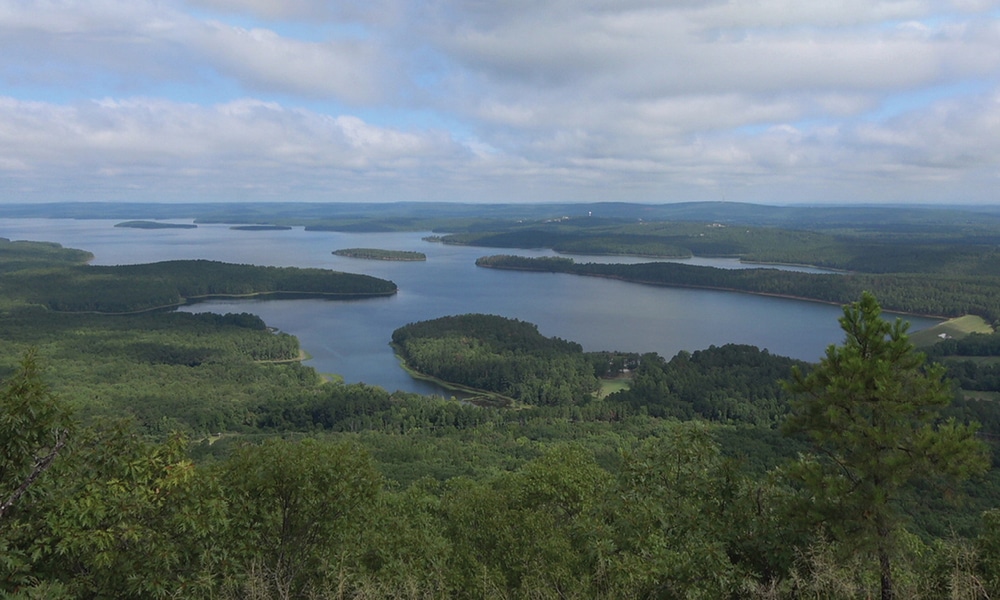
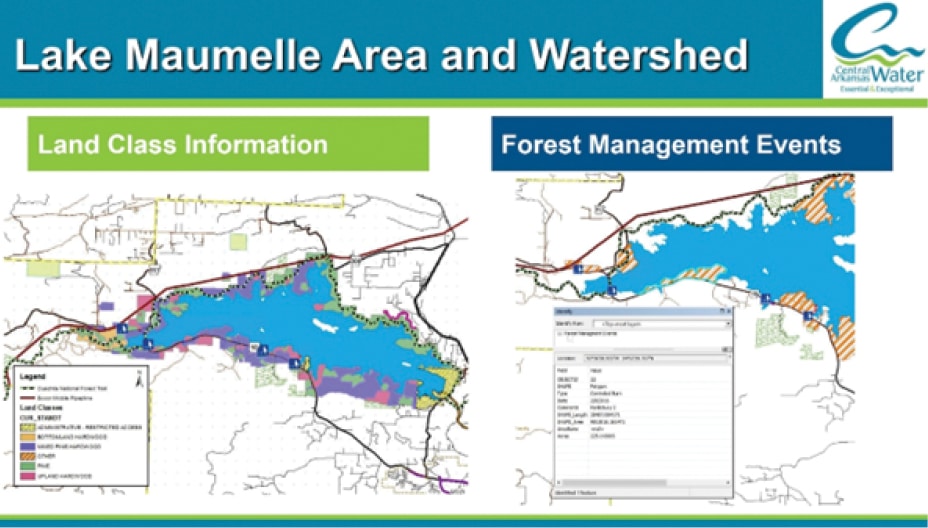
With over 115,000 acres of watershed surrounding CAW’s two source water lakes, the water quality specialists need accurate land use and ownership records, as well as detailed data from CAW’s water quality monitoring program, to guide the utility’s source-water protection efforts. CAW’s GIS team has been able to provide a multitude of different maps to effectively inform decision-making critical to preserving outstanding water quality (see Figure 10).
Protecting public health
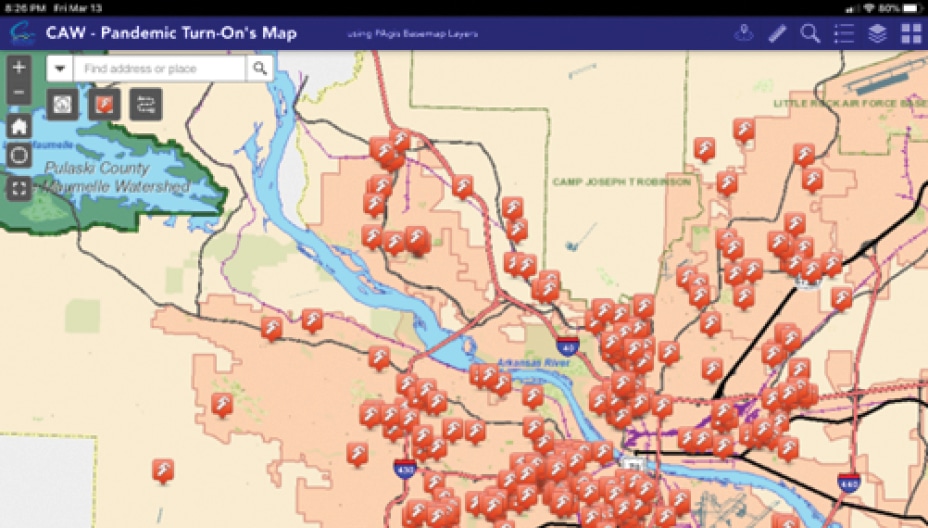
When the pandemic hit central Arkansas in March 2020, recognizing that water was crucial for the protection of public health, CAW’s GIS team quickly generated a map identifying the location of all service locations that had been turned off in the previous six months, enabling crews to restore service to every ‘shut-off’ services within 48 hours (see Figure 11).
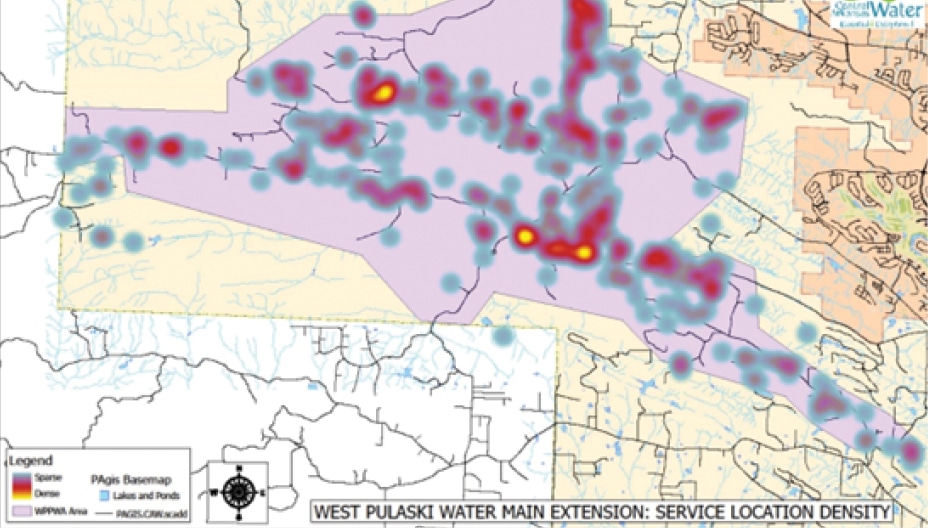
Utilizing maps prepared by GIS, CAW is able to plan expansion into unserved areas, reaching the areas with the highest density first (see Figure 12).
Managing water outage
Looking to the future, outage maps have been made available to field crews beginning in early June 2022. CAW is working to implement a solution that combines meter locations and customer contact information into Esri’s Water Outage Solution and GeoDecisions Notify application for outage management and notifications (see Figure 13). The time consuming task of going door to door is no longer required as field crews can generate an outage map and send a text notification to every impacted customer in a matter of minutes.
Location and other data are combined every day at CAW to maximize efforts, inform the public, and protect public health in an efficient and effective manner. This would not be possible without GIS information and the automated use of data (see Figure 14).