Recently, a new portal has been developed with support from the Alaska Ocean Observing System (AOOS), a region of the NOAA-led U.S. Integrated Ocean Observing System (IOOS) and the Alaska Center for Climate Assessment and Policy (ACCAP), the Scenarios Network for Alaska and Arctic Planning (SNAP). It is the first digital atlas on historical sea ice concentration for Alaska’s Beaufort, Chukchi, and Bering seas. It allows users to view and download sea ice concentration data since January 1850 to the present.
The idea behind a new portal was to show how ice concentration has changed over the centuries. It all started in 2000, compiling all sorts of sea ice data in Northern Alaska from whaling-ship logbooks to satellite imagery.
Dr. John Walsh, Professor at the University of Alaska Fairbanks (UAF) International Arctic Research Center with his two fellow campaigners at UAF Bruce Crevensten and Bill Chapman came together at the International Arctic Research Center of the UAF to create a unique historical atlas of Arctic sea ice development.
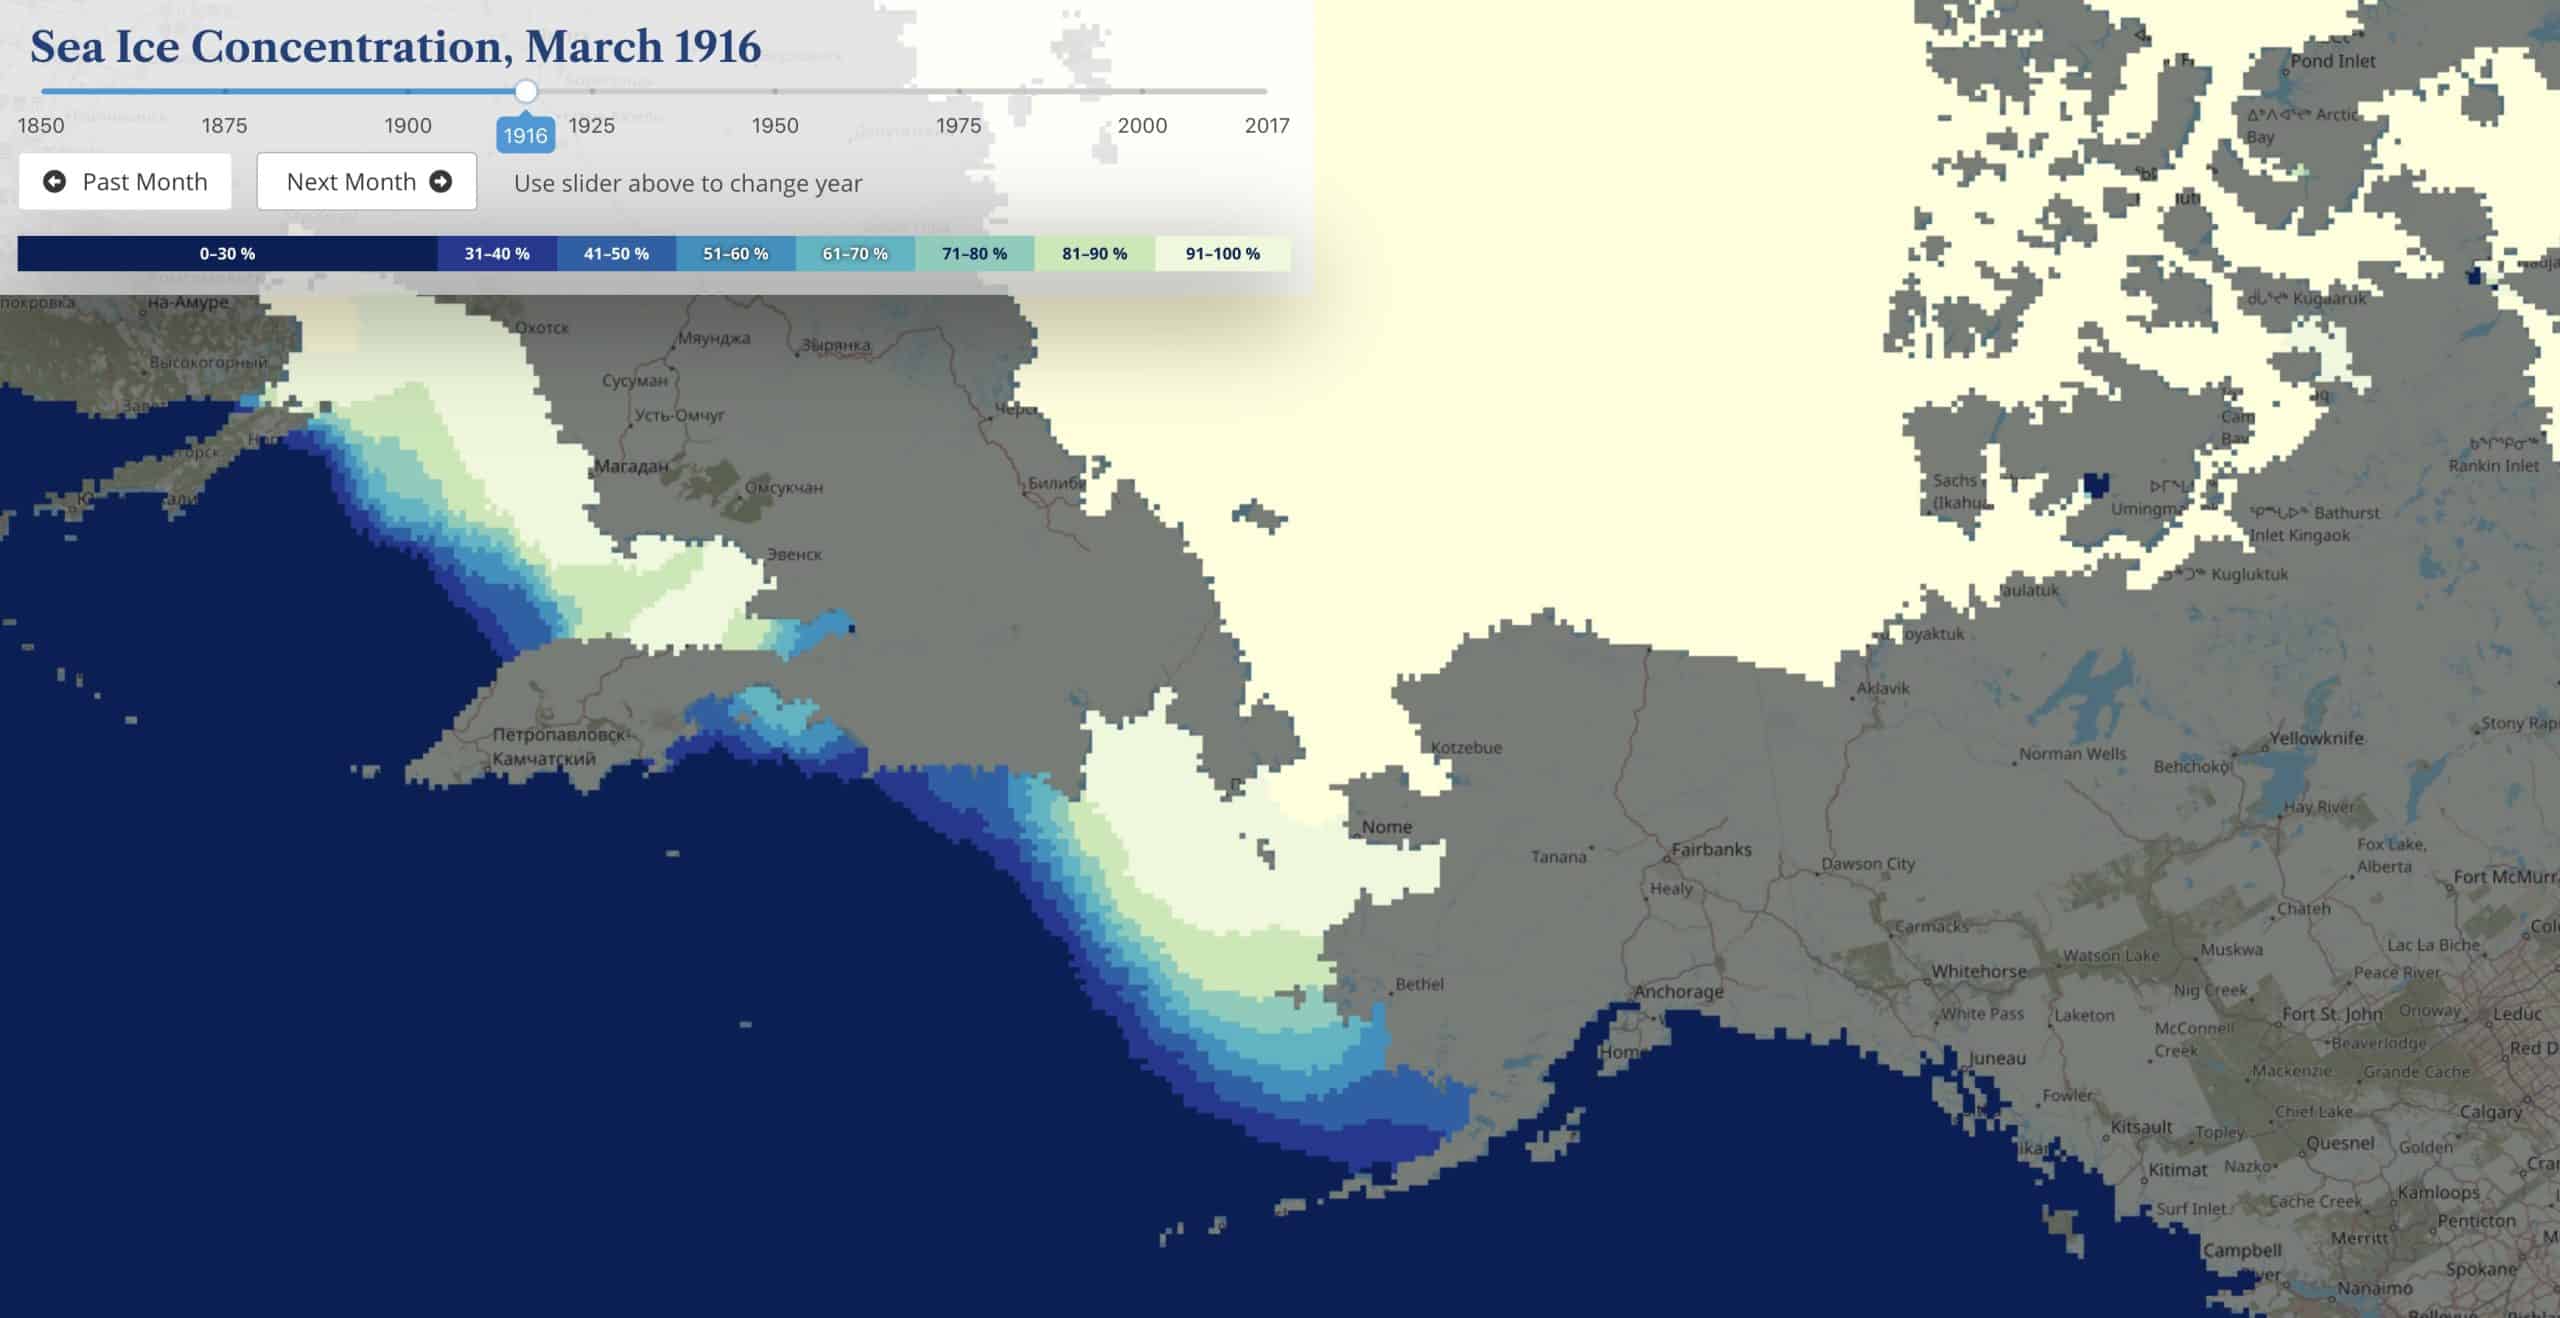
This atlas covers almost two centuries reaching back as far as 1850, offering a comprehensive time series of the Northern circumpolar Ice Shield. Spatial and temporal analysis eases discovery of patterns and assessing changes. On the portal, you can choose a region and time of interest and inspect a map of data collected between the mid-1800s and today to discover how ice extent and concentration have changed over time. By moving the slider visitors can explore changes in sea ice cover over 170 years in real-time.
Historical Sea Ice Atlas
One of the objectives of the project is to offer researchers a reliable tool to find time scales of variability, such as whether there is a 20-year cycle in sea ice.
“That is a research question. Researchers want to know about it scientifically,” adds Walsh. “If you only have 30 years of data, it’s really hard to say there is a 20-year cycle. But when you get to 160 years, you can start to see if any cycles hold up over time, whether they are reliable, robust enough to be considered real.”
Walsh said that however, data represents “snapshots” in time, as well as historical trends in arctic sea ice cover and extent. They are not projections or predictions of future conditions, nor is the atlas designed for forecasting or prediction, but it can provide useful historical context for future planning efforts.
Users vary from coastal community residents, fishermen, and hunters; the oil and gas energy industries; to military and maritime shipping agencies; and scientists. It can be a good educational classroom tool as well. AOOS will soon be integrating these data layers into their state-wide portal so users can view them alongside real-time conditions, forecast models, and a variety of GIS data.
Visualization of Data
The massively heterogeneous data powering the tool comes from more than ten different sources, including the satellite record (1979-present), various U.S. Naval and National Ice Center compilations (1950s to 1990s), Canadian records (1950s to 1980s), Danish and Norwegian ship records (mid-1800s to 1970s), and whaling ship reports (1850-1900).
These data sources were integrated with single, coherent data collection. In the data collection process, the rasdaman (an array database management system) datacubes played a vital role because its architecture ensured not only fast and easy access of arbitrary datacubes but additionally eased the process of homogenization during database import.
John Walsh, University of Alaska Fairbanks said, “Putting together the existing pieces into a comprehensive database that would let us tie it into the global mate picture: That was our real motivation.”
It enables users to select particular dates and locations and watch animations of how open water seasons have varied in time and space. The data can also be processed in graphic or map formats, on requests/demands. The atlas also includes a detailed glossary on types of sea ice and information on original data sources and how the data were compiled.