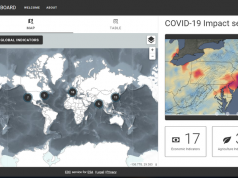
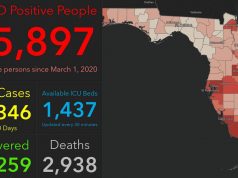
The Demographics by State COVID-19 Reporting (DSCovR) Dashboard is an interactive tool developed by a team from Columbia University’s Biostatistics Department to track and visualize state level demographics and trends for COVID-19.
The dashboard includes the following tabs:
- Maps: Provides a map-view of COVID-19 cases, hospitalizations and deaths, as well as the availability of demographic data at the state level.
- Demographics: Displays the age, sex and race distributions for COVID-19 cases, hospitalizations and deaths for a user specified state.
- State Comparisons: Allows for the user to compare demographic trends across three states
- Time Trends: Displays the number of new COVID-19 cases and deaths over time along with the 3, 5, and 7 day-average.
- About: Describes the process through which the dashboard was created and lays out important definitions throughout the tool


