

Taiwo Olalekan J.
Head, Environmental Information Systems Dept.
Environmental Resources Managers Ltd.
Plot 107A Imam Abibu Adetoro St. Victoria Island, Lagos State., Nigeria.
E-mail: [email protected]
Background to the Project
The data under this project covered the area popularly referred to as Niger Delta region of Nigeria. Administratively, the data coverage spanned through seven (7) states out of the thirty-seven states that make up the federation called Nigeria (see Figure 1). The Niger Delta area is the home to many of the oil and gas companies that are engaging in the exploitation and exploration of the large reserves of hydrocarbon present in the country. The activities of these companies have resulted in wide spread environmental degradation and pollution in this fragile ecosystem (NDES, 1997; OPTS, 2001). The ecosystem in the area has been described as fragile because the dominant vegetation types are mangrove and fresh water swamp forests. In addition, the area is also blessed with numerous rivers and creeklets and in fact the area has one of the largest deltas in the world (NEDECO, 1961). Furthermore, the Niger Delta area has one of the largest population islands in the country as the area has over three thousand five hundred autonomous communities. Due to the sensitive nature of this area therefore, adequate consideration for both the environment and the people have to be put in place in order to ensure the sustainable exploitation and exploration of the vast oil resources available in the area (NDES, 1997; NEST 1991).
In order to protect the environment and the people living in the oil prospecting areas, the Federal Government enacted various decrees and laws that guide the operation and activities of the oil and gas companies. The Department of Petroleum Resources (DPR) and the Federal Ministry of Environment (FMEEnv.) are the two parastatals of government that are responsible for the monitoring of the environmental compliance of the various activities of the oil companies in the Nigeria. While the DPR makes regulations for the prevention of the pollution of water resources and the atmosphere by the oil and gas operations in general (DPR, 1991), FMEEnv makes regulations to cover not only oil and gas operations but also industries such as brewery, wood and wood processing, food, tannery, metal mining etc. They serve as an environmental watchdog for all the oil company activities starting from the prospecting phase through exploration and even to the distribution phase.
These two agencies are also responsible for issuance of permits for the various activities of the oil and gas companies. This issue of permitting processes is the most significant control that these agencies exercise on the companies. For example, an environmental permit is required before a company can drill any oil well. The application for the permit is often accompanied by a report type. Different types of reports are required for different oil and gas activities and at different stages of their operations. Some of the known environmental reports include Environmental Impact Assessments (EIA), Environmental Baseline Studies (EBS), Environmental Evaluation Report (EER) and Environmental Monitoring Plan (EMP) etc. 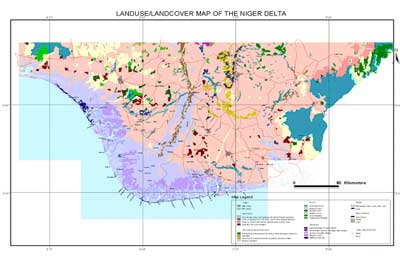
Environmental data collection is intensive as both primary and secondary data collection approaches are always employed. The methodologies of data acquisition and analysis have been well standardised in the country. The resulting reports from any environmental studies are often data intensive as they often consist of information about virtually all aspects of environment ranging from vegetation, wildlife, soil, water, underground water etc depending on the focus of the study. It is common therefore to find that similar reports have almost similar data. Most of the reports also contain raw field data and also the synthesized data. This is to allow for further verification of the data contained in the reports.
Project Justification
There are two major limitations to most of these reports especially those reports that predate 1995. The first limitation is that majority of them are in analog format. The problem is due to the low computer knowledge and high cost of hardware and software acquisition in the country prior to 1995. Hence, many of the reports are not computerised, therefore making storage of the data in digital format difficult. Secondly, many of them lack good georeferencing quality. In other words, the coordinate locations where field sample data were collected were not recorded in the reports. The absence of coordinate locations in most of the report may be due to low level of Global Positioning Systems (GPS) usage among most of the environmental companies for environmental data acquisition prior to 1995. This makes it difficult to reference almost all the data contained in most of the reports to their true geographical locations in space. The best that can be achieved might be to reference the entire data in a particular report to the facilities from where they were measured or to a particular oil field etc. However since science emphasises repetitiveness, it should be possible to go back to those precise positions (if the coordinates locations are known) and collect similar data at some time in the future.
The need to monitor, model and map environment over a long period of time has occasioned the need to have data acquired in a time series manner and in digital format (NDES 1997). To have data in time series then means that those pre 1995 data have to be converted to digital format and coordinates will have to be provided for the locations without any coordinates, before they are integrated into any available digital environmental database. Secondly, since precision in environmental data collection analysis and reporting is the focus in most of the environmental departments in many of the oil and gas companies, those pre 1995 data have to be georeferenced to their true locations in space. One advantage of this holistic approach to environmental data management is that it ensures that all environmental data are stored together. This would reduce or totally remove duplication by the oil company in data collection except when it is necessary as they can readily plot all their available environmental data within one single environment.
Methodology
The development of a spatial environmental database of this kind involves a number of activities which are briefly summarised below. However, it should be noted that some of the activities overlap with others. The environmental database discussed here was undertaken for one of the major oil producing company in Nigeria.
Review of Literature:
The project commenced with the review of about three hundred and fifty thousand bibliographic materials provided by the Company. The objective of the review was to identify those reports that contain useful data that can be used to develop an Environmental Database Project (EDP). In addition, the review was carried out to identify the data universe for the EDP. The data universe contains an extensive list of the entire available data field that would be represented in the environmental database. The data universe was arrived at based on the examination of all the data tables contained in all the reports. After the review, only about two hundred and eighty reports qualified to provide input into the database.
Data Model.
In the development of the spatial environmental database, it is important to decide on how data are to be extracted and stored. This is very important because this decision would influence how data are aggregated and modelled for subsequent use. The smallest or minimum unit of spatial data capture determines how data in database can be used and for what purpose. This decision is very crucial because it determines how data can be queried, analyse and to some extent linked. In this study, the unit of data aggregation is the sampling points. The choice of sampling points as the unit of data aggregation stem from the fact that environmental data are collected at specific point locations (Sample locations) in space. Once data are stored as point locations, they can later be aggregated to polygon level (Oil Mining Lease, Oil Field, Facility, state, or zone) or line level (Pipeline, river etc). The advantage is that once data are stored as points (Field sample locations) they can be aggregated to any other desired unit by the would be user of the database. It would also ensure that data are captured correctly. Other alternative units of data storage considered include facility level, state level or area of operation (West, East) level.
Classification of Reports
In order to make the database more intelligent, easy to understand and interpret, the reports covered under this project were classified into seven distinct groups. The major report groups identified are: Environmental Impact Assessment (EIA), Environmental Baseline Study (EBS), Post Impact Assessment (PIA), Special Studies, Compliance Monitoring, Drilling and Dredging, and Waste Management. Each of these major classes is made up of the following sub table, based on the type of data they contain; borehole physico chemical table, climate table, geology and geophysical table, sediment physico chemical table, socio economic table, soil sediment physico chemical table, vegetation table, and water physico chemical table. The table name describes the type of data the table holds. 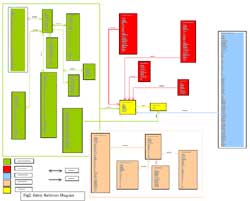
Fig 2: Entity Relations Diagram
Development of an Entity Relations Diagram
Once the data universe was identified, the entity relationship diagram was developed. The entity relation diagram is a diagrammatic representation of all the different tables as well as the fields that would be presented in the database. It shows how different data tables are to be linked to one another using some unique identifiers. This is achieved with the use of primary keys (unique identifiers). This entity relationship diagram was then sent to the client for review (see Figure2). This was to ensure that the developed model meets the client objectives. After it was reviewed and accepted, it formed the basis for the development of data population templates.
Development of Data Template
Data templates used for data extraction were arrived at after a comprehensive review of all the report types. From the review, a data universe was developed. The data universe represents the available column (data field) contained in the database. The data templates used were developed from the data universe developed for this project. In designing the data templates, the primary key field used are those anticipated dimension at which the database are likely to be linked such as (OML, state, facility type, report type). The data templates were developed using Microsoft Access, because it supports relational database. In all there were twenty-nine different tables in the database. Each table hold a different type of data.
Data Standardisation
There are many environmental companies providing environmental related services to the oil and gas companies in Nigeria. The companies employ different styles in data presentation and report writing. Often field data are reported in different types of formats and in different units. The units of measurements of some of the parameters have not been standardised and this has resulted in different companies using different units and format for recording the same parameter. This particular problem is more prevalent with heavy metals and some Cations. In order to resolve this issue, a workshop was held where decision as to what unit of data storage for the different kind of parameters measured and analysed was agreed on. In attendance at the meeting were representative of the oil companies, academicians, and other actors in the environmental business. The data were then converted into the agreed standard format before they were entered into the database. For example, in some of the reports, heavy metals were measured in part per thousand (ppt), when in actual sense they should have been measured in parts per million (ppm). All of them had to be converted into parts per million for uniformity. A small programme was written in Visual Basic to handle all conversion related issue with respect to the data entry.
Coordinate Scaling and Formatting
After the review of the available bibliographic materials covered under this project, it was observed that most of the reports do not contain the coordinate locations of where field samples were collected. It was however observed that all of them contained descriptions of where the samples were collected. The descriptions were in terms of whether the location is east, west, east or north of a particular pipeline, community or other known landmarks. In addition, some of the descriptions also contained the precise or approximate distance from the landmark. In other words, some of the reports contained the distance and directions from known landmarks. To obtain the coordinates of each sampled points, the descriptions of the sample locations as contained in the reports were supplied to the Geomatic Department in the Company. The department then used the descriptions (distance and directions) provided to generate those locations (coordinates) corresponding to the descriptions contained in those reports. Using this approach, it was possible to re-create almost all those coordinate locations for which the descriptions are available in the reports. The coordinate locations were then stored in the table holding the coordinate. In order to ensure uniformity in coordinate systems, the extracted coordinates were formatted to conform to the Nigeria datum.
Database Population
Manual data entry approach was employed in the database population. Tables found within the hardcopy reports were extracted into the corresponding database templates. Furthermore, each sample point was treated as a distinct and unique data.
Report scanning
All the reports were converted from analog to digital format through scanning. An HP Scanner was used for this purpose. Adobe Photo Editor Software was used to in conjunction with the scanner to scan the report. Acrobat Distiller software was then used to convert the scanned reports into Portable Document Format (*.Pdf). Each report was assigned a unique code that was also represented in the database. All the scanned reports were stored inside one folder to make report tracking easy. To ensure that there were no errors in report scanning, 10 percent of the reports were checked. This involved going through the hardcopy reports and checking them against the scanned equivalent on computer screen. The result of this activity shows that the scanning was completely successful as no errors were found in the scanned reports.
Customisation
The customisation involves the addition of seven additional menu items, which corresponds to the seven identified report categories to the Table view within ArcView GIS environment. The table view environment was selected for customisation because this view control all the table related activities within ArcView GIS environment. In addition, it already contains some menu items that would assist the users to do some form of display, query and analysis on the data. For each menu item, the seven sub-table already identified were also customized as submenu under each menu item. The submenus were further customised to call the corresponding table (see figure 3) from Microsoft Access using the Object Database Connectivity (ODBC). Since all the extracted data tables were stored as a Microsoft Access file, therefore, in order for the ArcView GIS to read the data from the Access environment, the ODBC was configured to read from the Access database (*.mdb). Within the ArcView environment, some basic script were written using Avenue programme. The scripts were largely designed to link the various submenus to the respective tables in Microsoft Access environment and display them as separate tables within ArcView environment. In addition, another menu item was provided in the table view that handles all the Meta data contained in the report. The menu item is called Meta data and it consists of table that contain the list of reports contained in the project. Also from the Meta data menu it is possible to open any of the scanned report. The report is opened as an Adobe Acrobat file. 
Figure 3: Sample data drop down menu
Quality Control and Quality Assurance.
To ensure integrity in the data extraction and entry, some forms of quality control and quality assurance (QA/QC) were put in place. The QA/QC were incorporated into the project at every phase of the project. The criteria used for the QA/QC include, conformity with data templates, data completeness and data accuracy. Conformity with data templates in this instance refers to the degree to which the data captured conform to the designed templates, while data completeness was taken to mean the degree to which the data available in the reports and for which there are specific templates have been extracted. This is very important in terms of QA/QC. A guiding principle in data extraction for populating database is that all useful data must be extracted as long as the data is valid and have gone through a vetting process. The client and or regulatory bodies concerned have already vetted the reports available for populating the database. The expectation is therefore that majority of the data therein are useful data. Data accuracy means the degree to which the stored template data is exactly what is in each report.
External personnel were appointed to carry out the QA/QC on the data. This is because we believed that it is not ideal for the same person that did the data entry to do the QA/QC. The personnel in charge of overseeing the QA/QC procedure of data conversion randomly checked 10 percent of the data entered into the database. If an accuracy rating of less than 90 percent is achieved, the sample is increased to 20 percent. If accuracy is still less than 90 percent, then a thorough review of data entry procedures and data entry staff was performed and the affected data re-entered into the database. In addition, the personnel randomly selected 10 percent of each of the report types then opened each of the representative tables where the corresponding field data was entered and check to see if the data contained in the report was correctly entered into the appropriate table. The entire process was documented.
Result
After the database population, linkage and customisation were completed; the project success was tested with some of the data it contained. The data were plotted on the Nigeria basemap within ArcView environment. The map shows clusters of sampling points in those areas where oil company’s facilities are located and in those special areas where they have carried out other similar studies.
Conclusion.
The approach helped to convert the over three hundred hardcopy reports involved under this project into a digital form. The tables contained in those reports are now being used to carry out change detection, compliance monitoring and baseline data evaluation. The project also serves to expose some of the limitations of the past field data collection methods. In order to overcome the problem of missing coordinate locations in the subsequent environmental data collection it is recommended that field template forms be developed for virtually all aspect of environmental data collection. The templates should be standardised for field data collection exercise. The use of field templates forms for environmental data collection should however be championed by the two regulatory bodies in Nigeria. This will ensure that there is uniformity in data collection among the different actors and stakeholders in the environmental business.
Reference:
- DPR Environmental Guidelines and Standards for the Petroleum Industry 1991 PG 98-114.
- ESI Mapping Standards and Protocols; Nigeria OPTS/NNPC November 2001.
- NEDECO (1961): The waters of the Niger Delta, Netherlands Engineering Company, Hague.
- NEST (1991): Nigeria’s Threatened Environment- A National Profile. Nigeria Environmental Study Action Team, Ibadan.
- Niger Delta Environmental Survey (NDES): Environmental and Socio- Economic Characteristics. Volume11 Sept 1997
- Niger Delta Environmental Survey (NDES): Evaluation of Data Gaps, database Management and Bibliography. Volume11 Sept 1997.


