
Ayad Mohammed Fadhil Al-Quraishi 1/2, Guang Dao Hu 1, Jian Guo Chen 1
1 Faculty of Earth Resources, China University of Geosciences, Wuhan 430074, China.
2 Ministry of Higher Education and Scientific Research, Foundation of Technical Education, Baghdad, Iraq.
Email: [email protected], [email protected]
Introduction
Land degradation is a complex ensemble of surface processes (e.g. wind erosion, water erosion, soil compaction, salinisation, and soil water-logging). These can ultimately lead to “desertification”. As the increasing world population places more demands on land for food production etc., many marginal arid and semiarid lands will be at risk of degradation. The need to maintain sustainable use of these lands requires that they be monitored for the onset of land degradation so that the problem may be addressed in its early stages. Monitoring will also be required to assess the effectiveness of measures to control land degradation.
The most typical and serious form of land degradation in China is desertification. Desertified land covers an area of 3.3 million km2, accounting for 34% of the total territory or 79% of the entire arid land in China (Chen et al., 1996). Over 100 million ha of grassland, 7.7 million ha of farmland and 0.1 million ha of woodland have been affected by degradation (Sun et al., 1998). Desertified sandy land increased by 25,200 km2 for the period from 1975 to 1987 about 40.5% of which was distributed in the semi-arid agropastoral regions of northern China (Zhu and Wang, 1993). At present, desertification is spreading with an annual growth of 10,400 km2, with 400,000,000 population affected. Annual direct economic loss caused by desertification is approximately 6,500,000,000 US Dollars (UNCCD, 2002). The basic premise in using remote sensing data for change detection is that changes in land cover result in changes in radiance values, which can be remotely sensed. Techniques to perform change detection with satellite imagery have become numerous as a result of increasing versatility in manipulating digital data and increasing computing power. Image differencing procedure is to register simply two images and prepare a temporal difference image by subtracting the digital numbers (DN) for one date from those of the other. The difference in the areas of no change will be very small, and areas of change will reveal larger positive or negative values (Lillesand and Kiefer 1987). The objective of this study is to detect, assess, mapping, and monitoring the land degradation risk in the study area in the northwestern part of Hebei Province, China, at county level using Remote Sensing ‘RS” and Geographical Information System ‘GIS’ technologies.
Study Area
Hebei Province is situated in temperate and warm temperate zones. The study area extends between latitude N 39° 27′ to N 41° 11′, longitude E 114° 24′ to 115° 55′. It covers an area of 20,828 km2, accounting 11.1% of the total area of Hebei Province. Northern and northwestern parts of Hebei are located in the temperate continental monsoon climate zone. Cold and windy winters and warm and dry summers are the general characteristics of the climate. The annual average rainfall ranges between 300 mm and 600 mm (Ministry of Civil Affairs and Ministry of Construction, 1992). Most of the rain comes between May and August. Figure 1 shows the location map of the study area in the Northwestern part of Hebei Province, China.

Figure 1. Location map of the study area in the Northwestern part of Hebei Province
Materials and Methods
Remote Sensing Data
A Landsat-5 thematic mapper (TM) imagery remotely sensed dataset (124/32) was assembled for this study, the period analysed was 1987 and 1996.
NDVI
The Normalized Difference Vegetation Index (NDVI) was initially proposed by Rouse et al. (1974). NDVI derived from the ratio of band 3 and band 4 in Landsat TM images data was applied for monitoring vegetation changes in the study area within the years of 1987 and 1996.
NDVI = (TM4-TM3) / (TM4-TM3)
Tasseled Cap Transformation (TCT)
Tasseled Cap transformation is one of the available methods for enhancing spectral information content of Landsat TM data. Tasseled Cap transformation especially optimizes data viewing for vegetation studies. Tasseled Cap index was calculated from data of the related six TM bands. Three of the six tasseled cap transformation bands are often used:
- Band 1 (Brightness, measure of soil).
- Band 2 (Greenness, measure of vegetation).
- Band 3 (Wetness, interrelationship of soil and canopy moisture).
The Tasseled Cap transformation provides excellent information for agricultural applications because it allows the separation of barren (bright) soils from vegetated and wet soils (ER Mapper, 1995).
Change Detection Methodology
Detection by image differencing (Lambin, 1994 and 1997) was adopted to detect the land cover change in our study complemented with visual comparison to distinguish and quantify the county-level change types. The procedures followed in our research are shown as following:
- Image to vector file rectification and image to image registration of the remotely sensed data using forty ground control points (GCP) whose ground coordinates were read from a vector file of the same scale for the same region. Accuracy with a RMS error of < 1 pixel (0.50 pixel) using the first model of polynomial function and Nearest Neighbor re-sampling method in datum WGS84 and projection UTM (50N).
- Tasseled Cap transformation (Crist and Cicone, 1984) on the TM images to convert the land cover information included in seven bands into three indicators: brightness, greenness and wetness, which respectively means the land bareness, vegetation vigor and soil moisture.
- Indicator differencing (e.g., NDVI, Greenness, Brightness, Wetness) between two different dates.
- Thresholding to acquire the changed areas and produce the general change maps which contain three classes: positive change, negative change, and no-change.
- Visual comparison to identify the types of land cover change (e.g., vegetation increase, land degradation) and creates detailed land cover change maps based on the previous general change map.
- Quantification of the land covers changes at county level by GIS technique.
Figure 2 shows the thresholding method to acquire the changed area using RS and GIS technologies for the study area in the Northwestern part of Hebei Province.
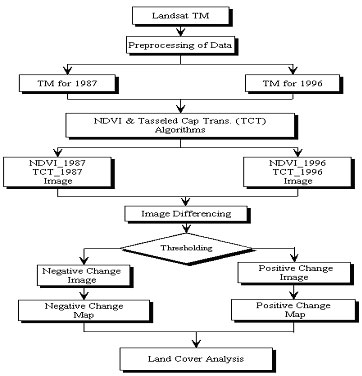
Figure 2. Flowchart of the land cover change detection method
Results and Discussion
Greenness Tasseled Cap Indicator
The results of the Greenness Tasseled Cap indicator were presented in table 1 and figures 3, 4. The results showed that highest greenness positive change (vegetation increase) was for Lai Shui County. It was 24.069% for the total area of the county.
The highest greenness negative change (vegetation degradation) value was for Chi Cheng County; it was 19.264% of the total area of the county. The vegetation cover increased by 17.462% of the total area of Lai Shui County in the period from 1987 to 1996; at a change rate 32.917 km2.yr-1. The overall greenness positive change (vegetation increase) in the district was 7.431% of the total areas, while it was 6.181% for the greenness negative change (vegetation degradation) over the whole district. The general average in the vegetation increase rate was 28.662 km2.yr-1, while was 23.842 km2.yr-1 for the vegetation degradation. The lowest percentage of no-change in greenness indicator was 76.171% for the total area of Chi Cheng County. The difference between the percentages for the greenness positive and negative changes was 29.009%, which means there is a vegetation increase in the studied area.
Wetness Tasseled Cap Indicator
The results showed that Chi Cheng County had the highest percentage (6.114%) of wetness positive change, while Wan Quan County had the lowest percentage (0.634%) for the total area of the county. Lai Shui County had the highest percentage of wetness negative change (3.830%) during the period from 1987 to 1996. The overall difference between the wetness positive and negative change was 1.642 % of the total areas of the counties in the region. The overall wetness positive change rate for the entire counties was 6.712 km2.yr-1, while was 3.259 km2.yr-1 for the wetness negative change rate. Table 2 and figures 5, 6 show the results of the wetness tasseled cap indicator.
Table 1. County-level Greenness Tasseled Cap indicator results of the Northwestern part of Hebei Province for the period from 1987 to 1996.
| County Name | County area | GN_P | GN_N | No-change | (GN_P)-
(GN_N) |
GN P rate | GN N rate | |||
| (km2) | (km2) | (%) | (km2) | (%) | (km2) | (%) | (%) | (km2 .yr-1) | ||
| Chi Cheng (1/2) | 2,647.565 | 120.856 | 4.565 | 510.034 | 19.264 | 2,016.675 | 76.171 | -14.699 | 13.428 | 56.670 |
| Wan Quan | 1,158.246 | 99.502 | 8.591 | 11.021 | 0.952 | 1,047.723 | 90.458 | 7.639 | 11.056 | 1.225 |
| Zhang Jia Kou | 405.414 | 46.040 | 11.356 | 4.538 | 1.119 | 354.836 | 87.524 | 10.237 | 5.116 | 0.504 |
| Cong Li (2/3) | 1,555.442 | 37.168 | 2.390 | 227.259 | 14.611 | 1,291.015 | 83.000 | -12.221 | 4.130 | 25.251 |
| Huai An | 1,692.094 | 83.782 | 4.951 | 26.388 | 1.560 | 1,581.924 | 93.489 | 3.392 | 9.309 | 2.932 |
| Xuan Hua | 2,474.029 | 141.923 | 5.737 | 50.193 | 2.029 | 2,281.913 | 92.235 | 3.708 | 15.769 | 5.577 |
| Huai Lai | 1,855.068 | 129.132 | 6.961 | 83.283 | 4.489 | 1,642.653 | 88.549 | 2.472 | 14.348 | 9.254 |
| Yang Yuan | 1,838.358 | 50.386 | 2.741 | 12.199 | 0.664 | 1,775.773 | 96.596 | 2.077 | 5.598 | 1.355 |
| Wei Xian | 3,182.889 | 235.979 | 7.414 | 138.719 | 4.358 | 2,808.191 | 88.228 | 3.056 | 26.220 | 15.413 |
| Zhu Lu | 2,788.724 | 306.705 | 10.998 | 142.507 | 5.110 | 2,339.512 | 83.892 | 5.888 | 34.078 | 15.834 |
| Lai Shui (3/4) | 1,230.852 | 296.252 | 24.069 | 81.325 | 6.607 | 853.275 | 69.324 | 17.462 | 32.917 | 9.036 |
| Sum | 20,828.681 | 1,547.724 | 7.431 | 1,287.467 | 6.181 | 17,993.490 | 86.388 | 1.250 | 171.969 | 143.052 |
| Average | 15.634 | 13.005 | ||||||||
Table 2. County-level Wetness Tasseled Cap indicator results of the Northwestern part of Hebei Province for the period from 1987 to 1996.
| County Name | County area | WT_P | WT_N | No-change | (WT_P)-
(GN_N) |
WT P rate | WT N rate | |||
| (km2) | (km2) | (%) | (km2) | (%) | (km2) | (%) | (%) | (km2 .yr-1) | ||
| Chi Cheng (1/2) | 2,647.565 | 161.862 | 6.114 | 31.998 | 1.209 | 2,453.705 | 92.678 | 4.905 | 17.985 | 3.555 |
| Wan Quan | 1,158.246 | 7.345 | 0.634 | 7.043 | 0.608 | 1,143.858 | 98.758 | 0.026 | 0.816 | 0.783 |
| Zhang Jia Kou | 405.414 | 11.507 | 2.838 | 5.837 | 1.440 | 388.069 | 95.722 | 1.399 | 1.279 | 0.649 |
| Cong Li (2/3) | 1,555.442 | 52.031 | 3.345 | 7.174 | 0.461 | 1,496.237 | 96.194 | 2.884 | 5.781 | 0.797 |
| Huai An | 1,692.094 | 16.766 | 0.991 | 14.819 | 0.876 | 1,660.509 | 98.133 | 0.115 | 1.863 | 1.647 |
| Xuan Hua | 2,474.029 | 39.950 | 1.615 | 21.313 | 0.861 | 2,412.766 | 97.524 | 0.753 | 4.439 | 2.368 |
| Huai Lai | 1,855.068 | 73.252 | 3.949 | 33.840 | 1.824 | 1,747.977 | 94.227 | 2.125 | 8.139 | 3.760 |
| Yang Yuan | 1,838.358 | 17.817 | 0.969 | 35.727 | 1.943 | 1,784.814 | 97.087 | -0.974 | 1.980 | 3.970 |
| Wei Xian | 3,182.889 | 95.089 | 2.988 | 88.340 | 2.775 | 2,999.460 | 94.237 | 0.212 | 10.565 | 9.816 |
| Zhu Lu | 2,788.724 | 159.514 | 5.720 | 29.421 | 1.055 | 2,599.789 | 93.225 | 4.665 | 17.724 | 3.269 |
| Lai Shui (3/4) | 1,230.852 | 29.421 | 2.390 | 47.140 | 3.830 | 1,154.291 | 93.780 | -1.440 | 3.269 | 5.238 |
| Sum | 20,828.681 | 664.555 | 3.191 | 322.651 | 1.549 | 19,841.475 | 95.260 | 1.642 | 73.839 | 35.850 |
| Average | 6.713 | 3.259 | ||||||||
Brightness Tasseled Cap Indicator
The result illustrated that the highest value of brightness positive change was in Cong Li County; it was 6.998% for the total area of that county, while the lowest value was 1.786% in Lai Shui County. The greatest percentage of brightness negative change was 11.321% of the total area of Xuan Hua County, while the lowest value was 1.240% in Lai Shui County. This county had the highest value (96.973%) of brightness no-change value.
The lowest negative difference value of brightness indicator for the study area was 8.379% of the total area of Xuan Hua County. The brightness positive change rate in the district within the period from 1987 to 1996 was 14.885 km2.yr-1, while it was 29.771 km2.yr-1 for the brightness negative change rate. Table 3 and figures 7, 8 show the results of brightness indicator.
Table 3. County-level Tasseled Cap brightness indicator results of the Northwestern part of Hebei Province for the period from 1987 to 1996
| County Name | County area | BT_P | BT_N | No-change | (BT_P)- (BN_N) |
BT P rate | BT_ N rate | |||
| (km2) | (km2) | (%) | (km2) | (%) | (km2) | (%) | (%) | (km2 .yr-1) | ||
| Chi Cheng (1/2) |
2,647.565 | 118.069 | 4.460 | 179.504 | 6.780 | 2,349.992 | 88.760 | -2.320 | 13.119 | 19.945 |
| Wan Quan | 1,158.246 | 32.058 | 2.768 | 106.098 | 9.160 | 1,020.090 | 88.072 | -6.392 | 3.562 | 11.789 |
| Zhang Jia Kou |
405.414 | 19.010 | 4.689 | 26.811 | 6.613 | 359.593 | 88.698 | -1.924 | 2.112 | 2.979 |
| Cong Li (2/3) |
1,555.442 | 108.853 | 6.998 | 106.949 | 6.876 | 1,339.639 | 86.126 | 0.122 | 12.095 | 11.883 |
| Huai An | 1,692.094 | 79.629 | 4.706 | 171.337 | 10.126 | 1,441.128 | 85.168 | -5.420 | 8.848 | 19.037 |
| Xuan Hua | 2,474.029 | 72.801 | 2.943 | 280.091 | 11.321 | 2,121.137 | 85.736 | -8.379 | 8.089 | 31.121 |
| Huai Lai | 1,855.068 | 48.040 | 2.590 | 183.688 | 9.902 | 1,623.339 | 87.508 | -7.312 | 5.338 | 20.410 |
| Yang Yuan | 1,838.358 | 79.532 | 4.326 | 116.366 | 6.330 | 1,642.460 | 89.344 | -2.004 | 8.837 | 12.930 |
| Wei Xian | 3,182.889 | 155.361 | 4.881 | 181.612 | 5.706 | 2,845.916 | 89.413 | -0.825 | 17.262 | 20.179 |
| Zhu Lu | 2,788.724 | 68.428 | 2.454 | 239.934 | 8.604 | 2,480.362 | 88.943 | -6.150 | 7.603 | 26.659 |
| Lai Shui (3/4) |
1,230.852 | 21.988 | 1.786 | 15.266 | 1.240 | 1,193.598 | 96.973 | 0.546 | 2.443 | 1.696 |
| Sum | 20,828.681 | 803.770 | 3.859 | 1,607.657 | 7.718 | 18,417.254 | 88.423 | -3.860 | 89.308 | 178.629 |
| Average | 8.119 | 16.239 | ||||||||
.
Generally, there were a vegetation increase, soil moisture increase, and soil bareness decrease in the region during the study period. There were a higher positive change in the greenness indicator values, a higher positive change in wetness indicator values, and a decrease in the brightness indicator values.
Normalized Difference Vegetation Index (NDVI)
The results of the NDVI indicated that the highest value of NDVI positive change (vegetation increase) was 13.321% for the total area of Lai Shui County. The highest negative change (vegetation degradation) was 8.511% in Cong Li County. The highest positive net difference (between the positive and negative changes) was 9.813% for the area of Lai Shui County, while the lowest was 3.949% of the area of Cong Li County. The highest positive change rate was 23.932 km2.yr-1 for Zhu Lu County for the period 1987 to 1996. The highest value of NDVI negative change rate was 14.7092.yr-1 in Cong Li County. Table 4 and figures 9, 10 show the results.
From the statistical analysis, the result illustrated there was a highly significant correlation coefficient between Tasseled Cap greenness indicator and the NDVI at 99% confidence level. The other correlations between brightness, wetness, and the NDVI were weak. Table 5 shows the results of the statistical analysis.
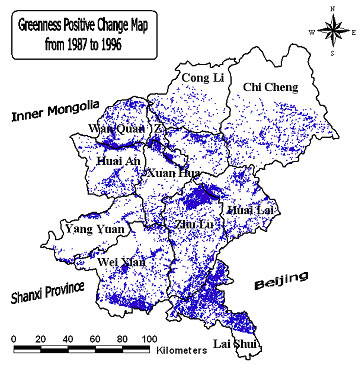
Figure 3. County-level Greenness positive change map of the Northwestern
part of Hebei Province during the period from 1987 to 1996
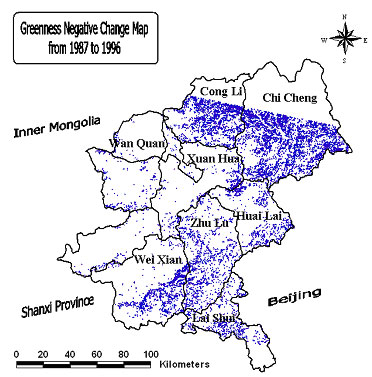
Figure 4. County-level Greenness negative change map of the Northwestern
part of Hebei Province during the period from 1987 to 1996

Figure 5. County-level Wetness positive change map of the Northwestern
part of Hebei Province during the period from 1987 to 1996
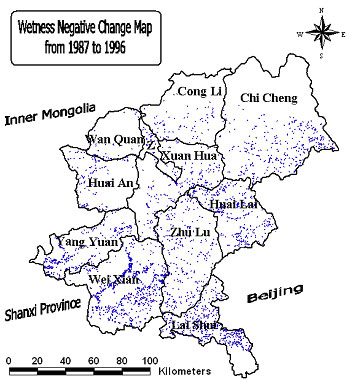
Figure 6. County-level Wetness negative change map of the Northwestern
part of Hebei Province during the period from 1987 to 1996
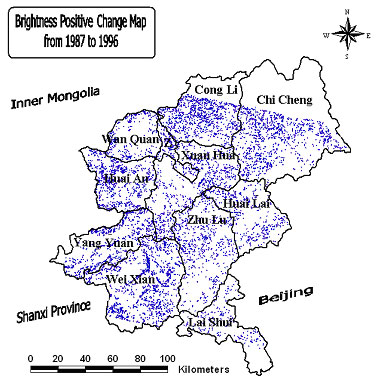
Figure 7. County-level Brightness positive change map of the Northwestern
part of Hebei Province during the period from 1987 to 1996
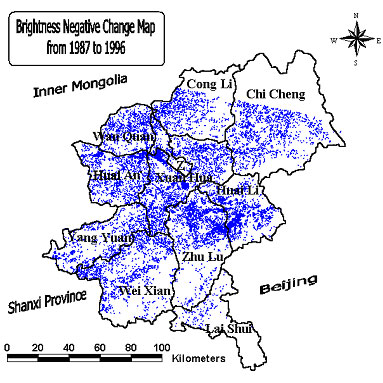
Figure 8. County-level Brightness negative change map of the Northwestern
part of Hebei Province during the period from 1987 to 1996
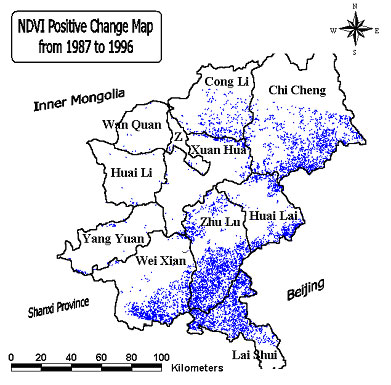
Figure 9. County-level NDVI positive change map of the Northwestern part
of Hebei Province during the period from 1987 to 1996
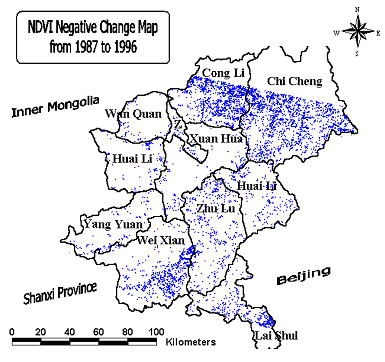
Figure 10. County-level NDVI negative change map of the Northwestern part
of Hebei Province during the period from 1987 to 1996
Table 4. County-level NDVI results of the Northwestern part of Hebei Province for the period from 1987 to 1996.
| County CODE | County area | NDVI_P | NDVI_N | No-change | (NDVI_P)-
(NDVI_N) |
NDV_ P rate | NDVI_ N rate | |||
| (km2) | (km2) | (%) | (km2) | (%) | (km2) | (%) | (%) | (km2 .yr-1) | ||
| Chi Cheng (1/2) 2,647.565 | 35.849 | 1.354 | 69.814 | 2.637 | 5,189.468 | 98.005 | -0.641 | 3.983 | 7.757 | l |
| Wan Quan | 1,158.246 | 0.839 | 0.072 | 6.667 | 0.576 | 1,150.740 | 99.352 | -0.503 | 0.093 | 0.741 |
| Zhang Jia Kou | 405.414 | 2.079 | 0.513 | 5.483 | 1.352 | 397.851 | 98.135 | -0.840 | 0.231 | 0.609 |
| Cong Li (2/3) | 1,555.442 | 40.166 | 2.582 | 132.384 | 8.511 | 2,162.949 | 92.612 | -3.949 | 4.463 | 14.709 |
| Huai Hua | 1,692.094 | 3.242 | 0.192 | 12.361 | 0.731 | 1,676.491 | 99.078 | -0.539 | 0.360 | 1.373 |
| Xuan Hua | 2,474.029 | 27.486 | 1.111 | 19.554 | 0.790 | 2,426.990 | 98.099 | 0.321 | 3.054 | 2.173 |
| Huai Lai | 1,855.068 | 71.518 | 3.855 | 25.021 | 1.349 | 1,758.530 | 94.796 | 2.506 | 7.946 | 2.780 |
| Yang Yuan | 1,838.358 | 7.032 | 0.383 | 12.414 | 0.675 | 1,818.912 | 98.942 | -0.293 | 0.781 | 1.379 |
| Wei Xian | 3,182.889 | 113.031 | 3.551 | 95.482 | 3.000 | 2,974.376 | 93.449 | 0.551 | 12.559 | 10.609 |
| Zhu Lu | 2,788.724 | 215.392 | 7.724 | 54.078 | 1.939 | 2,519.254 | 90.337 | 5.785 | 23.932 | 6.009 |
| Lai Shui (3/4) | 1,230.852 | 163.963 | 13.321 | 43.184 | 3.508 | 1,023.705 | 83.170 | 9.813 | 18.218 | 4.798 |
| Sum | 20,828.681 | 680.597 | 3.268 | 476.442 | 2.287 | 19,671.64 | 94.445 | 0.980 | 75.621 | 52.937 |
| Average | 6.875 | 4.812 | ||||||||
Table 5. Correlation matrix and regression equations between the studied indicators for the Northwestern part of Hebei Province
| Correlations Matrix | ||||
| BT | GN | WT | NDVI | |
| BT | 1.0 | 0.084 | 0.003 | -0.042 |
| GN | 0.084 | 1.0 | 0.144 | 0.704 |
| WT | 0.003 | 0.144 | 1.0 | 0.263 |
| NDVI | -0.042 | 0.704 | 0.263 | 1.0 |
| Regression equation | ||||
| NDV | NDVI= 9.31388+0.335838*(GN)R2 =49.517 ** | |||
| GN | GN=51.3252+1.47445*(NDVI)R2 =49.517 ** | |||
| ** | There is a statistically significant relationship between the variables at the 99% confidence level | |||
Conclusion
In general view, the study area revealed an increase in tasseled cap greenness indicator, tasseled cap wetness indicator, NDVI values during the study period from 1987 to 1996, which means that there was an increase in the vegetation cover and soil moisture. In the same time showed an decrease in the tasseled cap brightness indicator values, which points to decrease in the soil bareness. By other words, there was a decline in the land degradation in the region during the study period.
This study demonstrates the effectiveness of the remote sensing and GIS technologies in detecting, assessing, mapping, and monitoring the land degradation. The outcome of this type of studies represents a valuable resource for decision makers to guard against land acquisition, and for future development projects in the study area in the Northwestern part of Hebei Province, China.
References
- Chen, G., Z. Dong, and P. Yam. 1996. Desertification: International Research Topics and Research Strategies in China. Exploration of Nature, 15, 1-5 (in Chinese).
- Crist, H.P., and R.C. Cicone 1984. Application of the Tasseled Cap Concept to Simulated Thematic Mapper Data. Photogrammetric Engineering and Remote Sensing, vol. 50(3): 343-352.
- ER Mapper, 1995. ER Mapper Tutorial. Earth Resources mapping Pty Ltd.
- Lambin, E.F. 1994. Modelling deforestation processes (A Review), Tropical ecosystem environment observations by satellites. TREES series B: Research Report no l. EUR15744EN, pp: 45-101.
- Lambin, E.F. 1997. Modelling and Monitoring Land-Cover Changes Processes in Tropical Regions. Progress in Physical Geography, Vol. 21: 375-393.
- Lillesand, T.M., and R.W. Kiefer. 1987. Remote Sensing and Image Interpretation. John Wiley and Sons. New York. p. 599. Ministry of Civil Affairs and Ministry of Construction. 1992. Encyclopaedia of Chinese Counties. vol. North China, China Social Publishing House, Beijing.
- Rouse, J. W., R. W. Haas, J. A. Schell, D. W. Deering, and J. C. Harlan, 1974. Monitoring the Vernal Advancement and Retrogradation (Greenwave Effect) of Natural Vegetation. NASA/GSFCT Type III Final report, Greenbelt, MD, USA.
- Sun, H., H. Zhou, and P. Wang. 1998. Progress in Research on Degradation Succession of Grasslands. Grassland China, vol.1: 51-56.
- UNCCD, 2002. China National Report to Implement the United Nation’s Convention to Combat Desertification. New York.
- Zhu Z.D., and T. Wang. 1993. Trends of Desertification and its Rehabilitation in China. Desertif. Contr. Bull. 22: 27-30.


